Graham & Peter Meeting
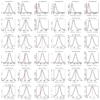

Fig 1
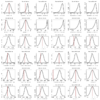
Fig 2
- Decided that bootstrapping against fixed model parameters would be more difficult to interpret, Fig 1.
- Simulated data results with refitting seem strange (Fig. 2), perhaps related to fitting of the tree. Observed LR for data should at least remain symmetric, so something has gone wrong.
- Expected pattern should be deducible simply by upper left triangle of graphs, should accept the first model where the data becomes typical.