Detecting a warning signal of collapse isn’t about detecting that a system is non-stationary, but more specifically, that the system is about to do something sudden. The classic saddle-node bifurcation example results in a picture like this:
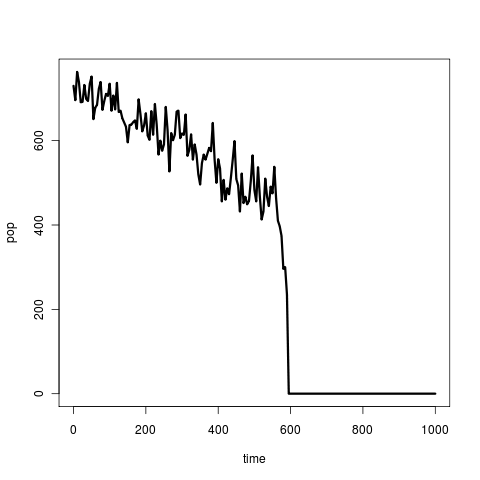
A visible steady decrease interrupted by a sudden jump. The goal is to distinguish this from the case of a steady decrease that involves no loss of stability – such as would be created by continually lowering the carrying capacity of logistic-model system at a linear rate. As one involves a loss of stability and the other does not, the warning signal that attempts to measure the eigenvalue (equivalent to r in the standard logistic formulation) may enable one to distinguish between these two possibilities. The picture that seems so often described is one of no change in mean, followed by a sudden jump. Such a pattern can be produced in a bistable system simply by waiting long enough – as addressed through the theory of large deviations. Such a case may instead result from loss of stability, even without the mean changing. To explore this, I’ve constructed an example explicitly to avoid the mean changing but still show a change in stability before the bifurcation:
\[ d(x) = a \left( \hat x - K \right) + e K \]
and
\[ b(x) = \frac{e K x^p}{x^p+h^p} \]
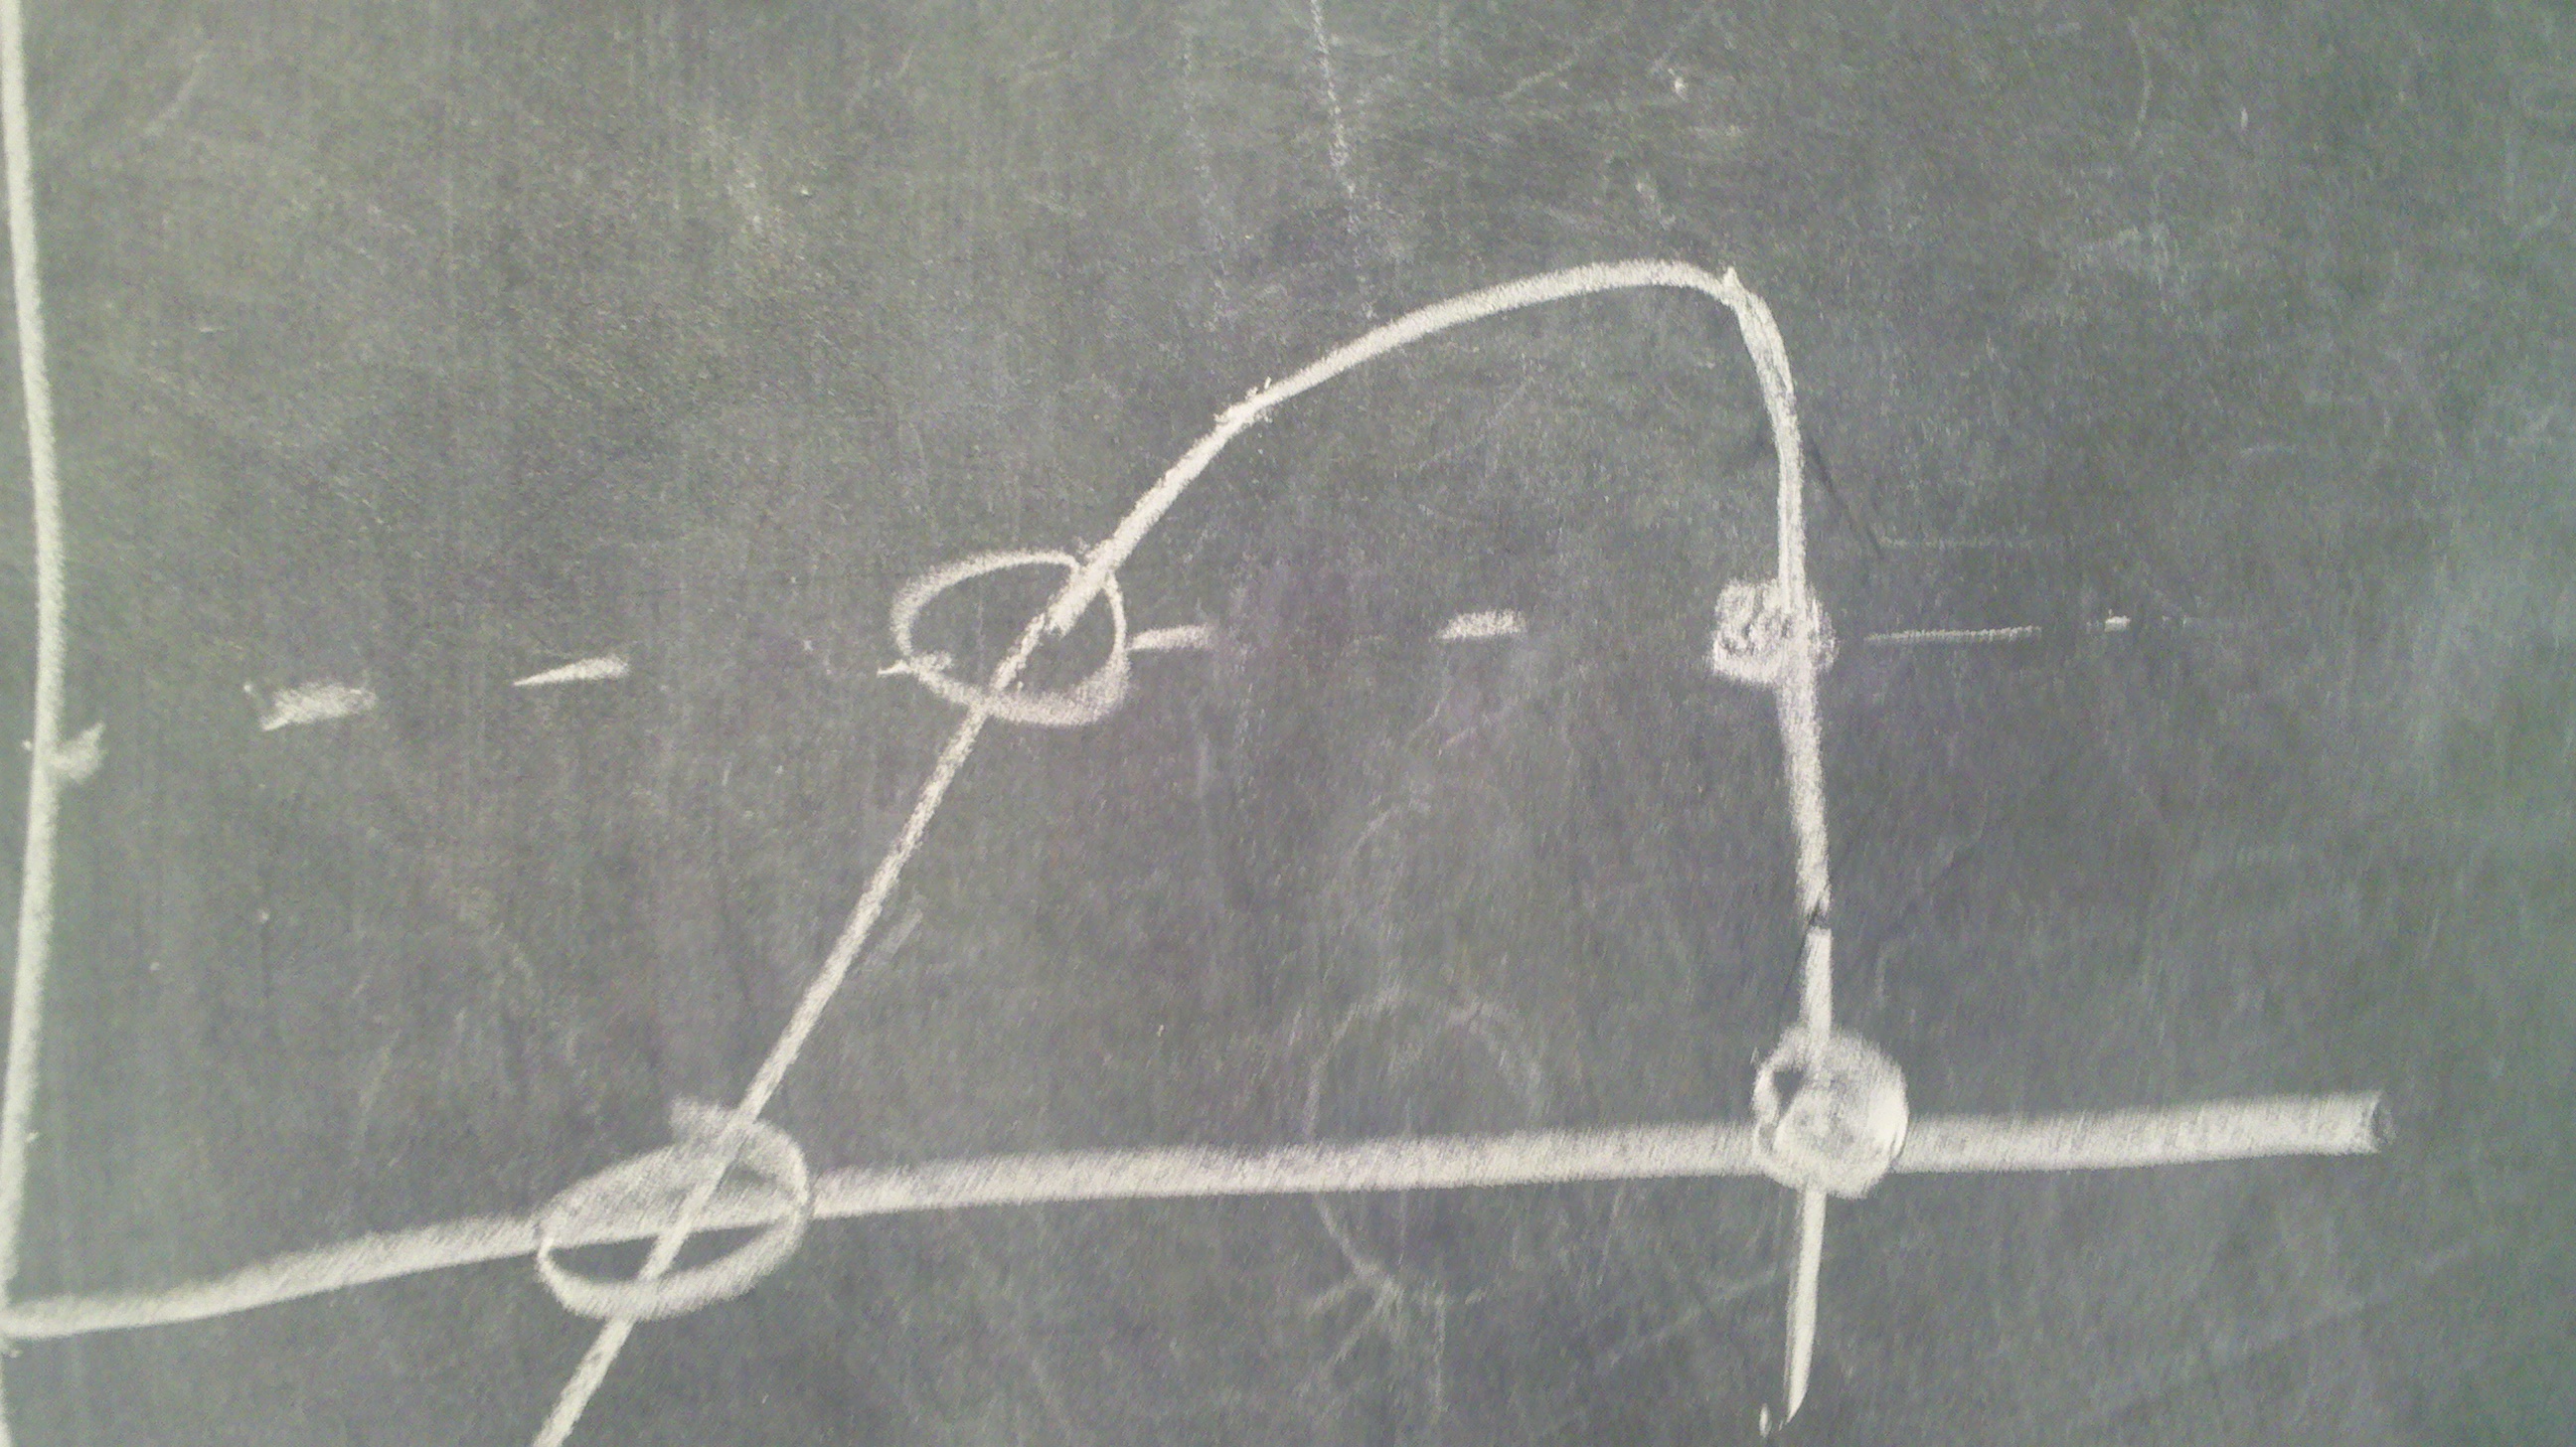
with $ a $ as the bifurcation parameter:
The red line is the death rate, blue the birth rate, and black the difference. (Code is the first figure in this version of saddle_analytics .R). Such cases may have a rather simpler analysis, since changes in the equilibrium size can be ignored, but are less general and hence less common than the cases that may include changes in expected value of the state.
Of course one can also imagine examples where most of the change will occur pretty much without warning, i.e. if the growth rate function looks like:
Then the unstable point moves a great deal closer but no stability is lost until right before the bifurcation, hence there is very little warning. In either case, there is a tendency to attempt to correct for any trend. The general idea of this is quite valid – the loss of stability should appear in the variance, while the trend could have other causes (so could an increase in variance, but leaving that aside), so we do need to handle this correctly. However, this overlooks the crucial second observation:
Noise dependence on mean
In general, the noise magnitude scales with the system state, as either \(\propto \sqrt{X_t} d W_t\) (in our demographic examples) or linearly. (environmental noise) The decreasing state can obscure the increasing variance due to loss of stability. Methods which simply subtract out a trend will fail to reflect this phenomenon. At least for ecological systems where the state is a population abundance driven by a birth-death process, the assumption of no dependence,
\[ dX_t = \alpha (\theta - X_t) dt + \sigma dW_t \]
is unjustified. This should not impact the actual estimate of the correlation time (autocorrelation rate or width of the Lorentzian from the power transform), but does impact the variance.
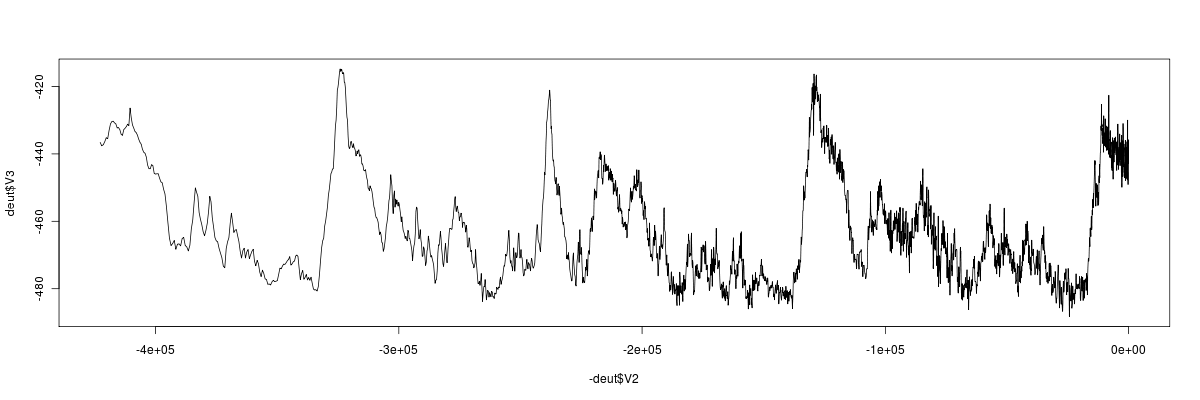
Reflections in an example
Example coming: consider the isotope data in the climate change shifts, showing several jumps and among the examples considered in Dakos et al. 2008:
See other data sets, listed inearlier lab notebook entry (still on OWW).
https://www.flickr.com/photos/cboettig/5115516967/in/photostream/
Comments on ONS
Images today are all included from flickr stream, embedded with Flickr Gallery plugin with the exception of the gif. As viewing animated gifs requires access to the original image, this prompted me to upgrade to Flickr Pro. Will be interesting to explore what can be done without limits, meanwhile the animated gif is a bit annoying. Today’s live feed reflects some of explorations on R animations in gifs and otherwise, see my bookmarks in delicious.
Recent posts have adopted the WP LaTeX plugin for equations. Seems to work better than a few other plug-ins I tried (strange positioning etc), but open to suggestions on quick load times, machine readable equations, proper appearance.