Multiple-uncertainty
- Created smaller version of table to simplify comparisons
- Switched to stationary policy comparisons only. (Running out over longer time shifts total value a bit but doesn’t amplify scale of the differences much)
- Larger noise amplifies the effects (compare 0.3 levels to 0.5 levels)
- note that averaging over replicates gives rather consistent means. The differences between successive runs of the algorithm give results agreeing to the tenths place at least.
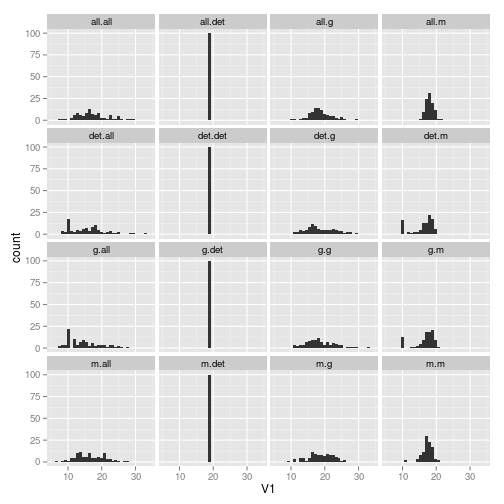
Tables of results
Note that columns represent the decision-maker’s beliefs about uncertainty and rows represent the true uncertainty present in the simulation.
| det | g | m | all | |
|---|---|---|---|---|
| det | 19.11 | 19.11 | 18.81 | 18.81 |
| g | 18.92 | 18.63 | 18.74 | 18.56 |
| m | 16.17 | 16.76 | 17.38 | 18.08 |
| all | 15.54 | 14.65 | 16.50 | 17.15 |
| det | g | m | all | |
|---|---|---|---|---|
| det | 0.00 | 0.00 | 0.00 | 0.00 |
| g | 4.41 | 4.31 | 3.59 | 3.28 |
| m | 3.10 | 2.96 | 1.60 | 1.12 |
| all | 5.06 | 4.89 | 4.20 | 4.59 |
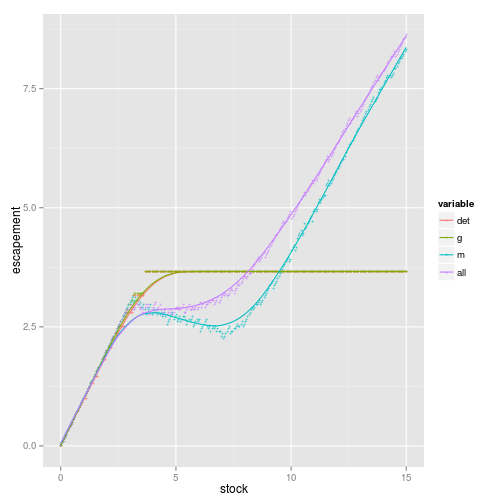
logistic case
Overcompensatory density dependence is tough on stock. With given discounting (5%) and finite horizon (15 cycles) strategies act conservatively. Hmm, strange that deterministic case is equally effected..
running with much weaker
rto reduce overcompensatory impacts…
Coding
Attempting to translate algorithm into Jim’s native tongue (matlab) for feedback. R version vs matlab not there yet…
Reviewing
- Another review request, another review done.
Misc
- With Alistair, playing around with this HMM EM algorithm gui11aume/HMMt. Also threw in a pull request with documentation. grr, took a bit to understand what was going on with that paper.