Trying to select clear examples of sufficient and sufficient power in detecting warning signals. Addressing a couple side issues today as well:
Proper handling of trends
Best model for eigenvalue change
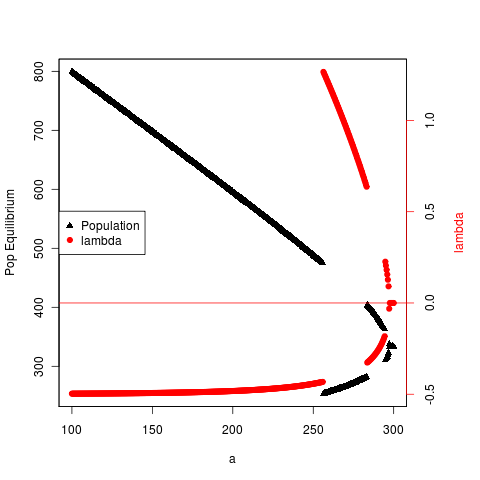
Computed an example with steeper nonlinearity to compare rate of change in lambda. Here’s an example with Hill coefficient of 5 (see codefor details). Note that the plot simply shows whichever root the numerical algorithm converges to at the time, should modify to express all roots.

(I’ve also updated the C code saddle node simulation to adjust Hill coefficient, but still have to add the wrappers to let this be set from the R level, details in the github repository).
In the canonical form of the saddle-node bifurcation, \(\tfrac{dx}{dt} = x^2+a =: f(x)\) the equilibrium moves as the square root of the parameter, \(r = \pm \sqrt{x}\) and the eigenvalue is directly proportional to the equilibrium, \(\tfrac{df}{dx} = x\). The larger the nonlinearity, the larger the skew. As the canonical form can be viewed as a Taylor series on any saddle node bifurcation, to leading order we should be using the sqrt approach of lambda to zero wrt our bifurcation parameter: \(d\lambda/dt = -\sqrt{a}\)
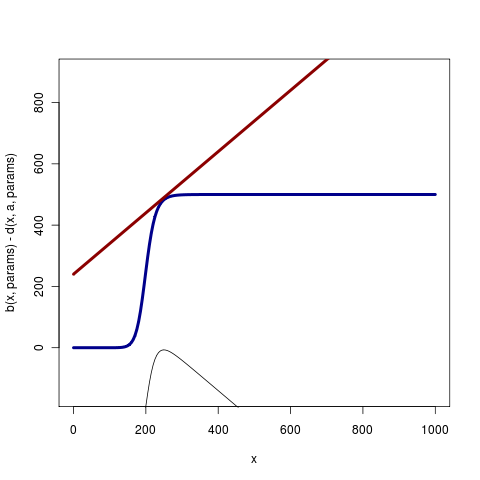
Also working on trends - in this case, change in theta over time that must also be accounted for. So both are quadratic rates of change in the canonical model. If the bifurcation parameter is moving over a large range, the nonlinearity can be quite visible, but with the goal of detecting only small changes, the linear change is defensible. Seems the signal from the eigenvalue cannot be more sensitive than the change in the mean (in the saddle node bifurcation)? Recall the goal is to detect a system that appears to be linearly decreasing, but is about to fall off an edge, vs a system that is linearly decreasing without decreasing stability. Showing the birth rate and death rate functions at the point of the bifurcation: (code)

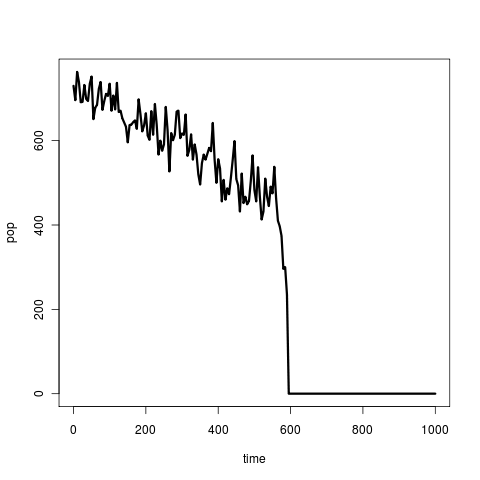
So these are essentially the models we want to compare. Why warning signals are so often discussed as if the mean is not expected to change does not match the basic model or the original question – it’s detecting catastrophes, not detecting changes that we’re interested in. Hence the corresponding crash to such a figure (actually with Hill coef p = 2)
