Working on more examples for the notebook. Currently exploring a collection of simulated examples. In particular, would be useful to have simulated examples that look as realistic in data-density as possible (i.e. fewer sample points, also shorter sampling interval relative to timescale, so doesn’t look like a fuzzy caterpillar. Second, would be good to include examples on data simulated from non-linearized systems made to represent some richer bifurcation examples. Finally it would be good to include as many real-data examples as reasonable.
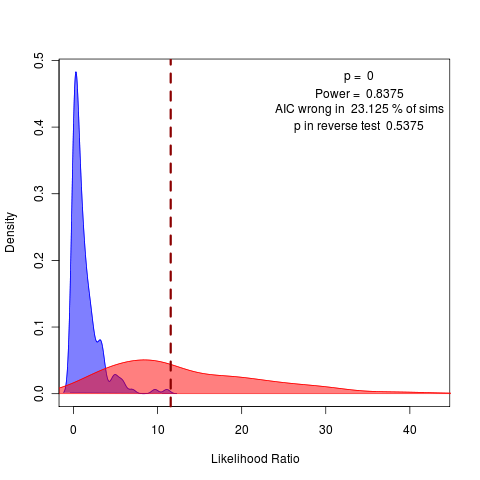
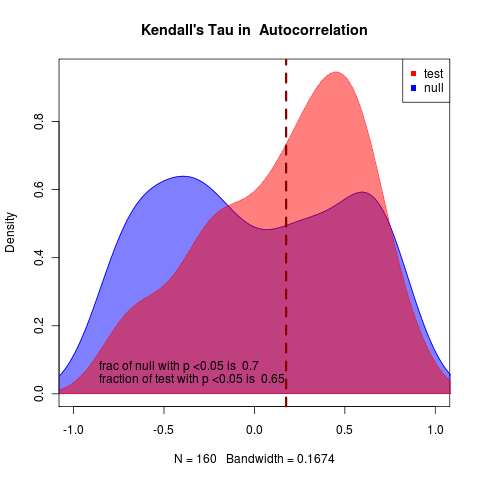
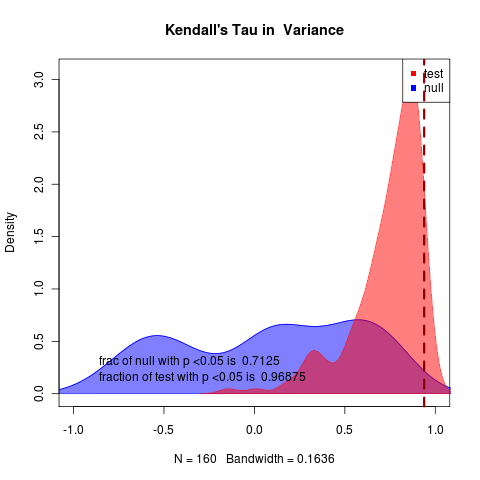
Running at m = 0.03, N=500
very clear in likelihood and rather clear in summary statistics as well, though summary statistics null remains highly variable. 1600 replicates
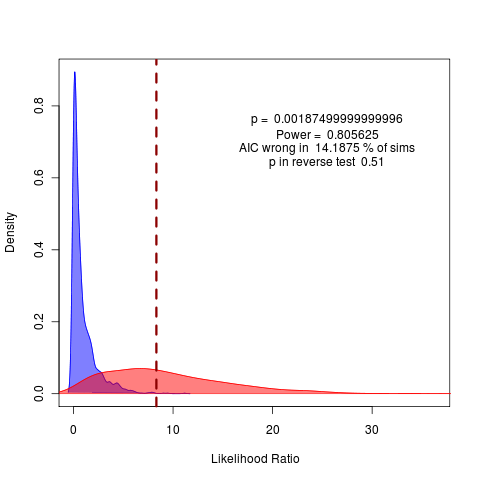
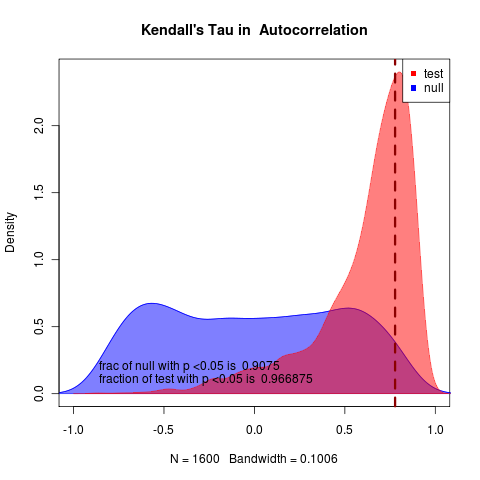
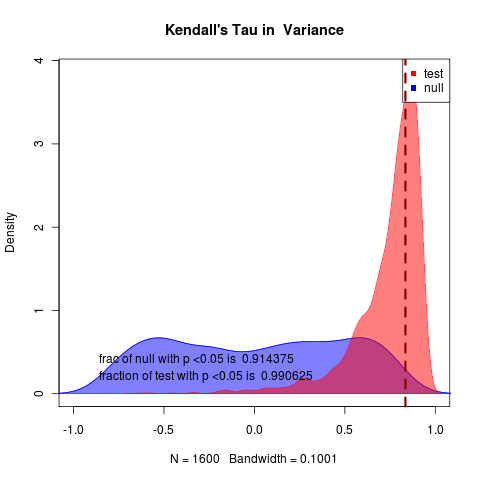
Rerunning at m=-0.02 still with N = 500 nice 19
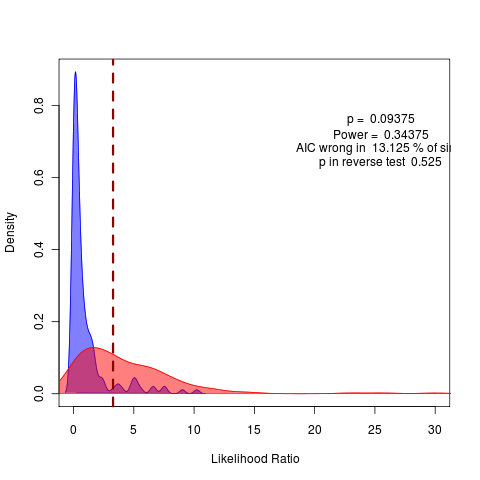
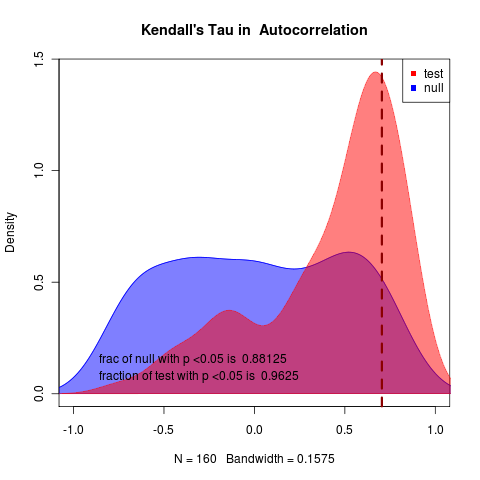
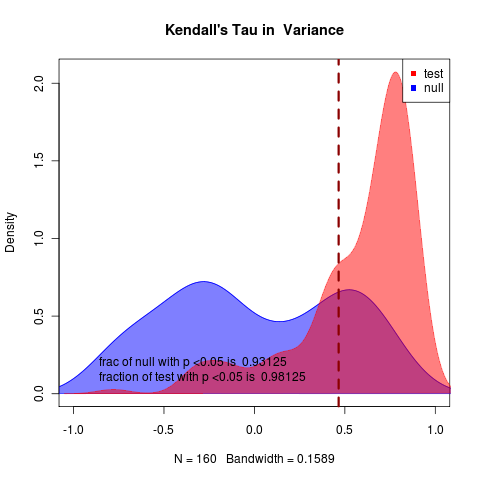
rerunning at m=-0.03 with N = 50 nice 1
pretty hopeless:

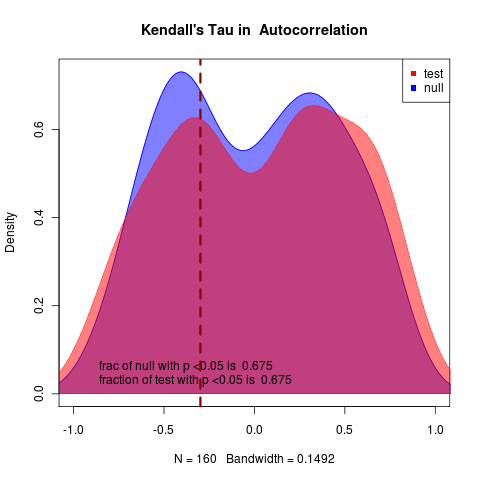
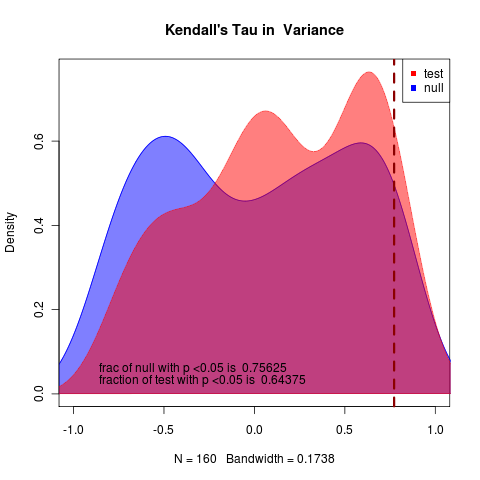
rerunning at m=-0.05 with N = 50 nice 0
(hits collapse at end of time), can clearly tell apart, Though with notable uncertainty in indicator statistics, though variance performs substantially better than autocorrelation.
Better tracking of computational objects
Problem: Saving .Rdat files to match the script-name and tracking those files in git does not provide a good map between code and results. Running the same script simultaneously with different parameters would mean that the datafile was overwritten by the first and could have hashtags on figures not correspond to the current version of the data commit.
This also means tracking binary .Rdat files in git, which both takes up extra space and isn’t readable by diff/display tools.
Solution: Rather than only running differently-named scripts simultaneously (or avoiding runs on the the same repository code) it makes more sense to track the data to the computational object directly.
The .Rdat files should be saved using a unique hash name corresponding to the result.
They shouldn’t be revision managed.
This should be handled automatically within social_plot in the socialR package.
This identifier needs to be by flickr id, as git hashtag isn’t unique to the result; the graph is the computational object.
Now implemented in package. Can store all datafiles in a local repository, no need to keep them on the cloud server as they can always be reproduced by rerunning the code – storing the .Rdat output is really about efficiency and convenience.
For completeness this might store the git hash too. Could play with ls environment. Getting ls environment right to save the appropriate data requires manipulating R environments, as ls() inside a function returns only what that function sees.
    if(save){
        save(list=ls(globalenv()), file=paste(flickr_id, ".Rdat", sep=""))
    }
Computational Notebook to-do
Considering a git guide for notebook: setting up, jumping back to a hashtag version, running the code to make any figure, etc
flickr guide?
AWS/EC3 guide