Considering the case where there is a cost to changing the harvest quota (representing the cost of efforts to change policy). We can imagine several scenarios that could introduce this:
Fixed cost to change
Cost proportional to the size of the change (L1 norm)
Cost proportional to the square of the size (L2 norm, i.e. small changes aren’t expensive, large ones are very expensive)
asymmetric costs – lowering quotas may be harder than raising them
Implementation:
Before, we could calculate the optimal harvest rate for each value of the state variable $ x_t $ on the grid, at each time step (using Bellman’s equation for the value-to-go). The optimal solution was given by a matrix of size n by T, where n is the grid size and T the stopping time - n rows for the states, T columns for the timesteps. Now we have to have the optimal harvest level at state $ x_t $ calculated out for each possible value of last year’s quota ( h_{t-1} ), to know how big a change we’re considering. This makes our matrix n by n by T (if harvest can assume any value on the grid, it has n options – we might make the harvest grid coarser or bounded at some h_max < x_max).
I think I have this right(?) Slower to compute this much bigger optimum, but here we go:
Results
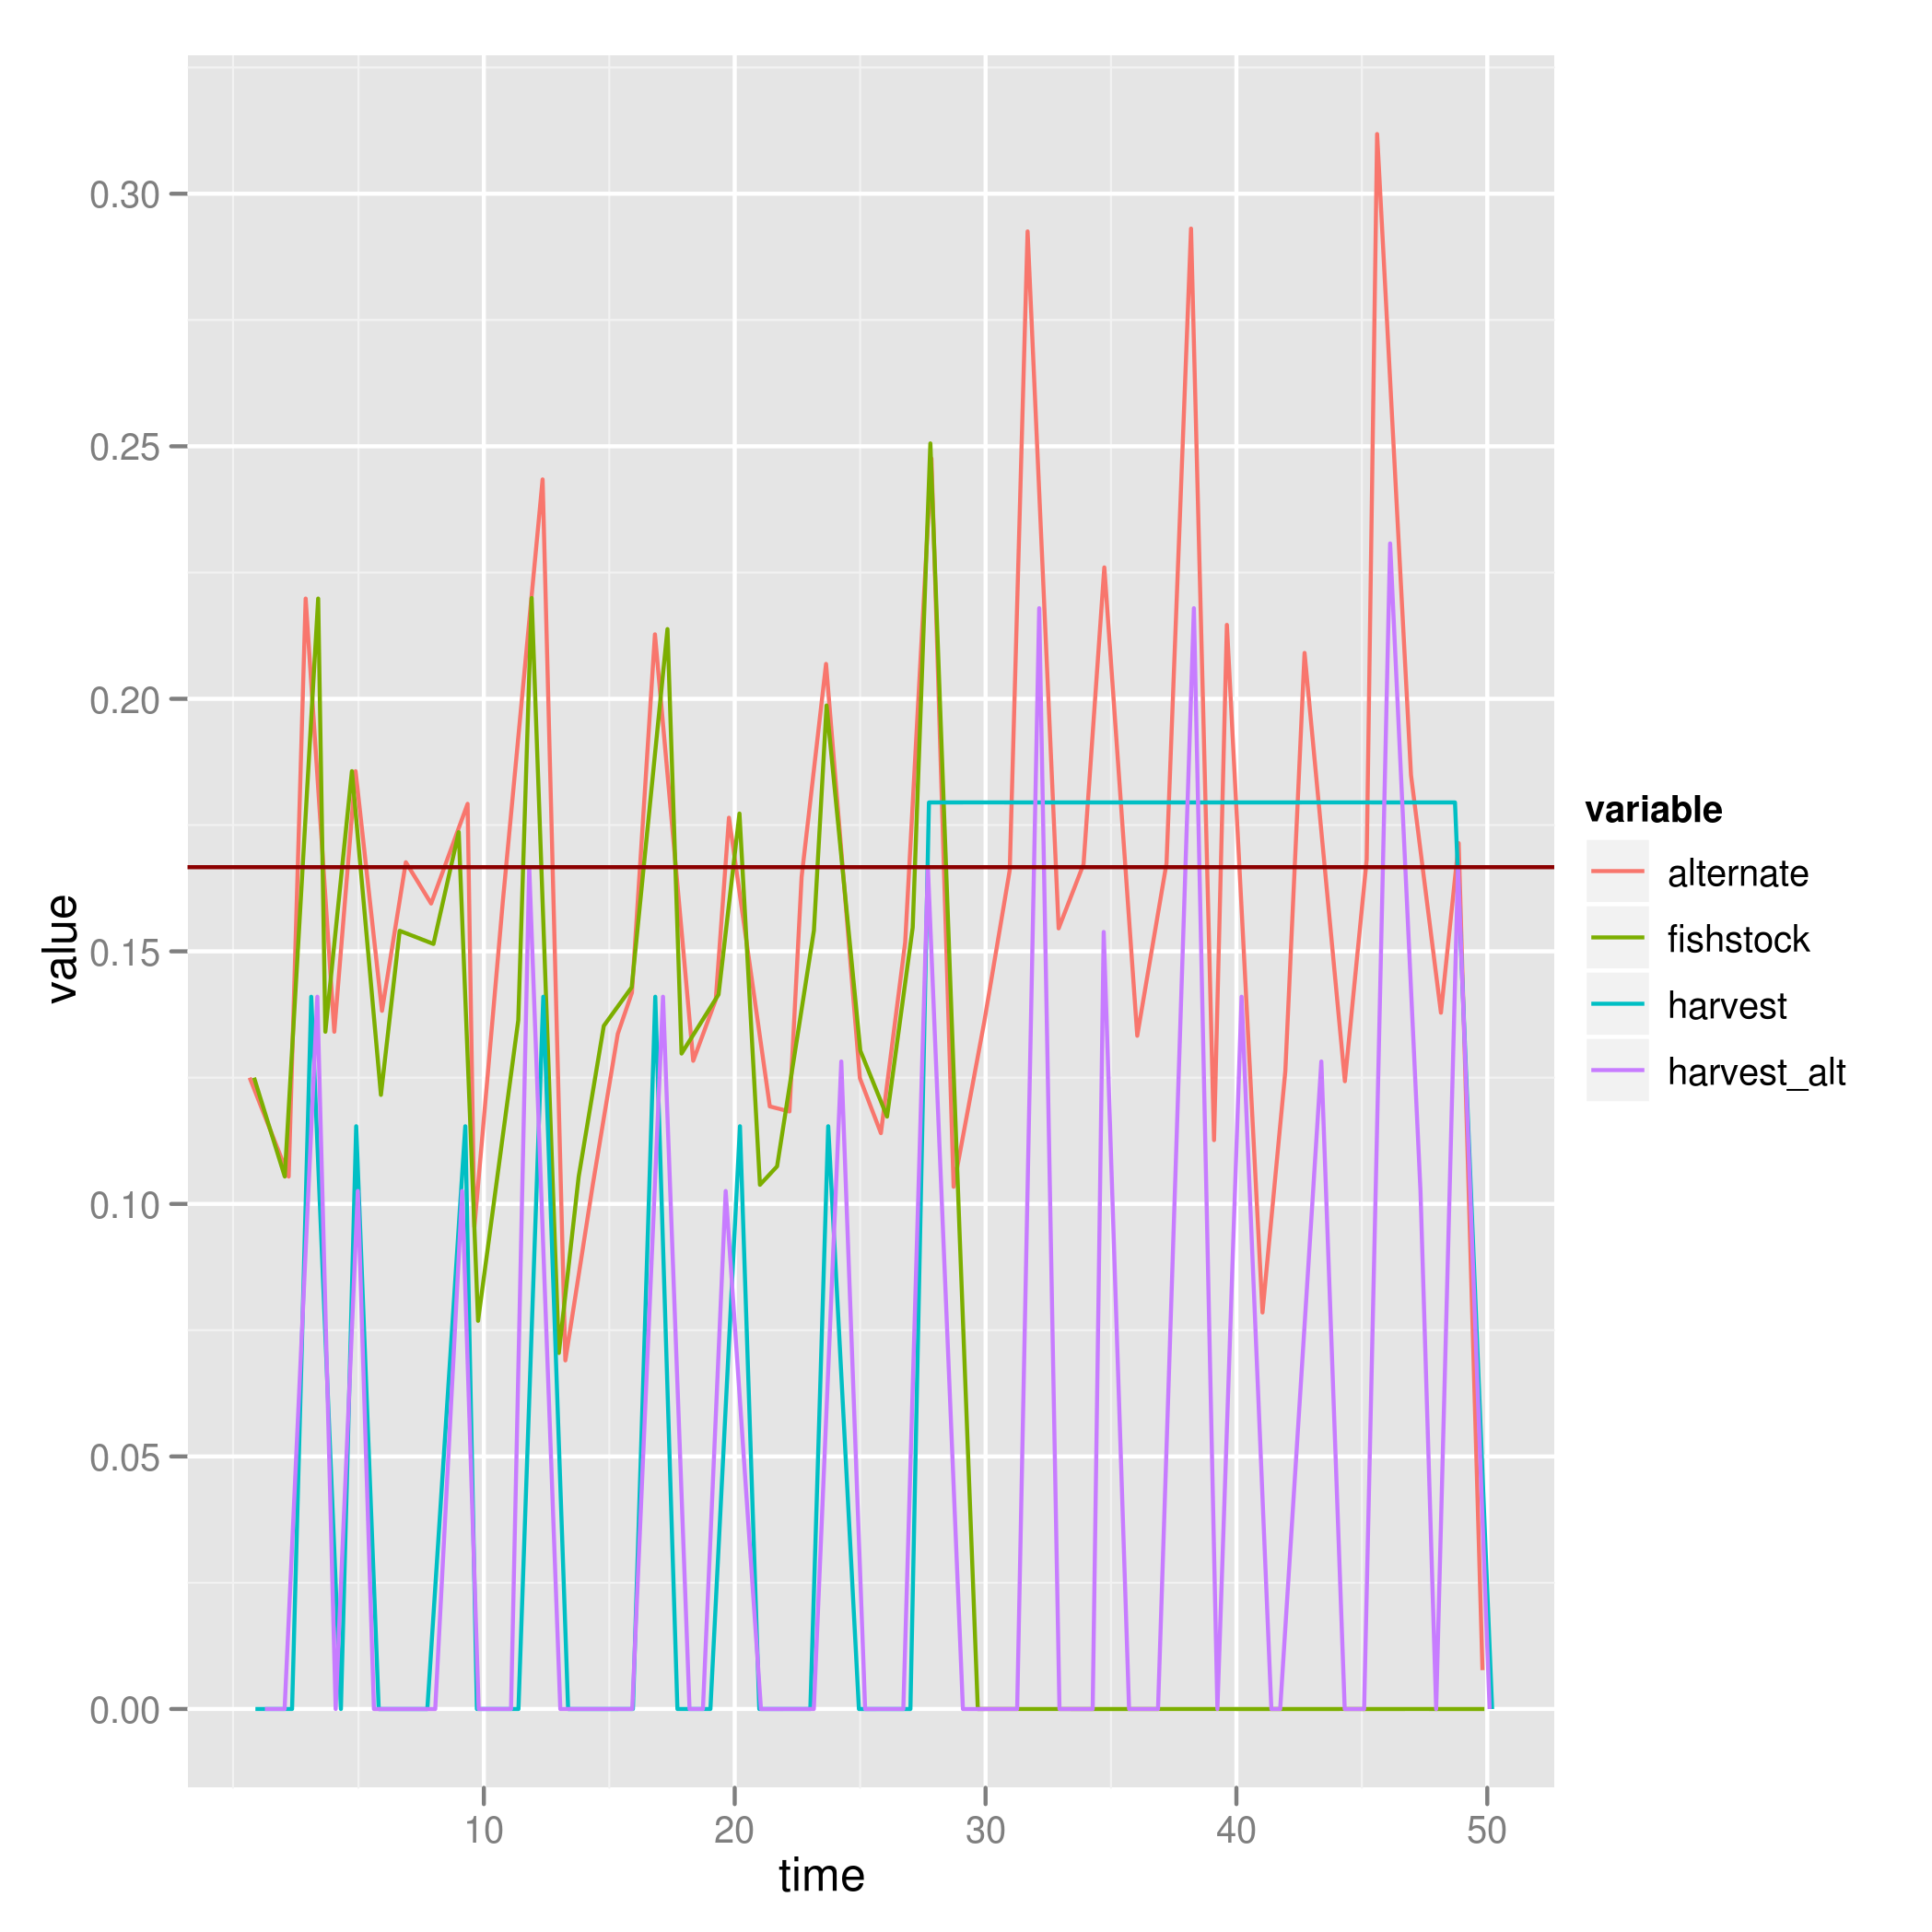
L1 norm tends to follow the optimal solution to a point, and then give up on changing the policy – putting the harvest all the way up and running the population to extinction:

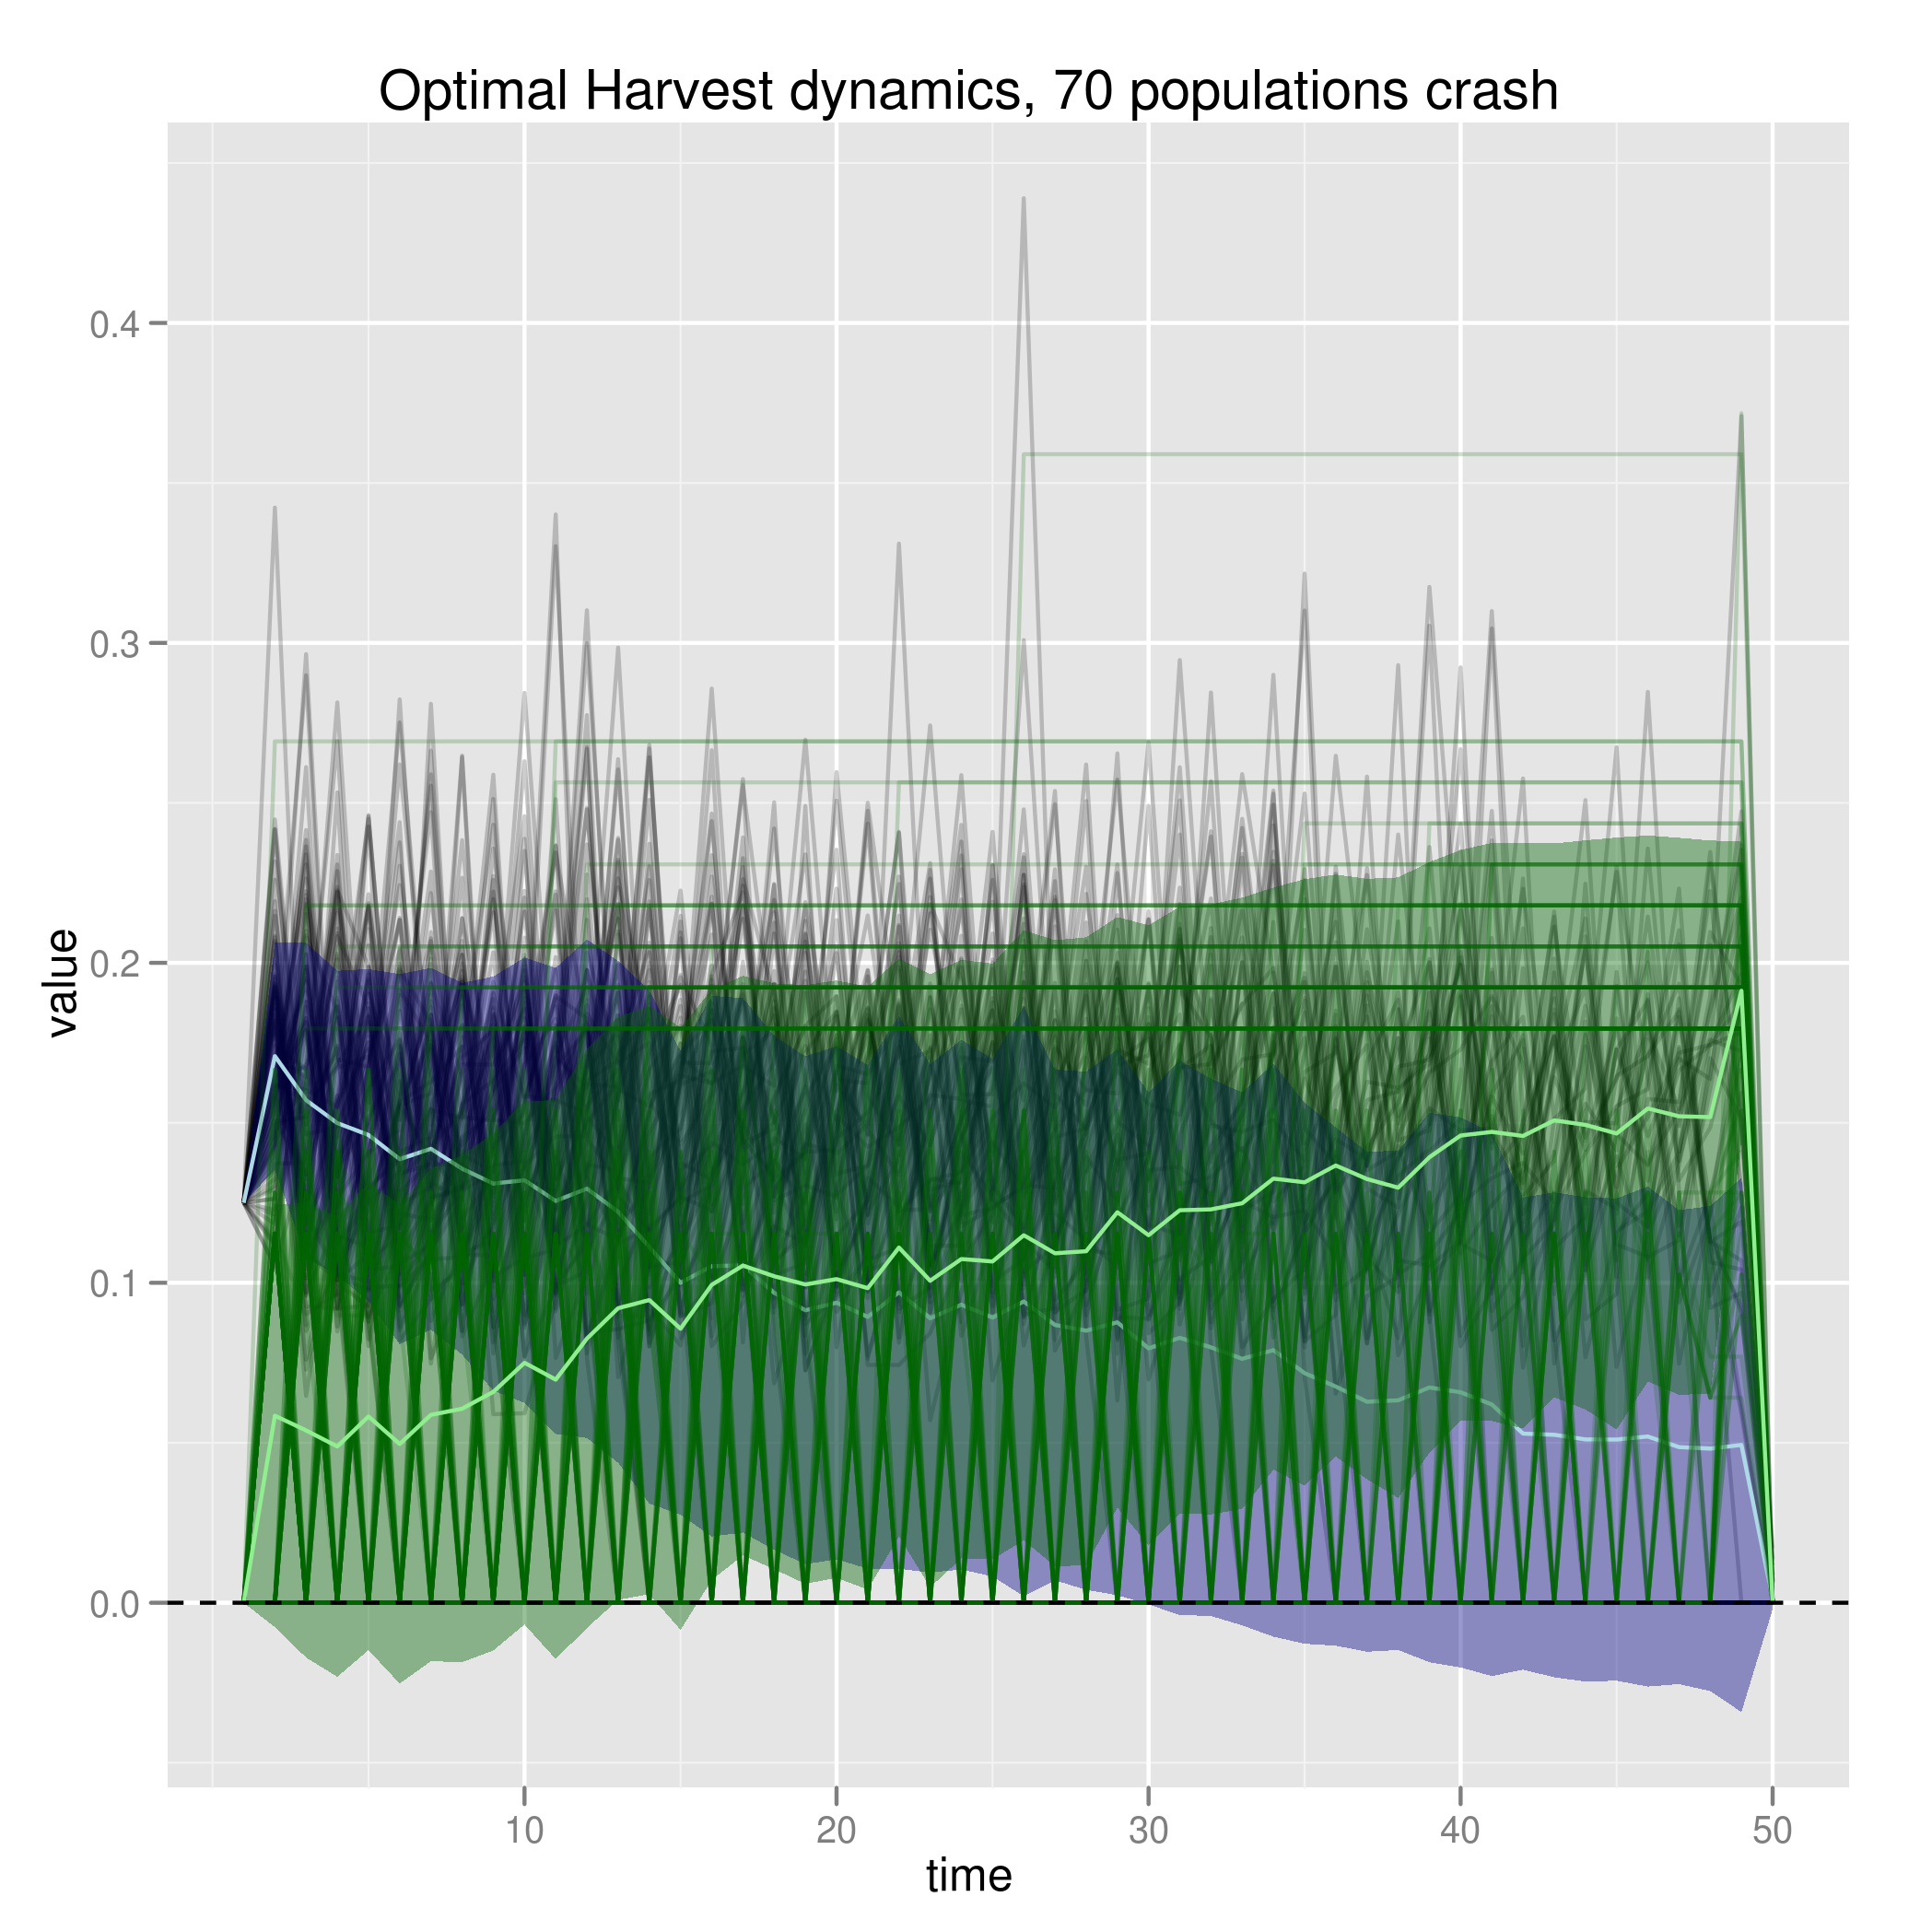
The “alternate” line shows what the fishstock would have been if there was no cost to changing the policy (the classical Reed optimum), and its harvest rate is shown as harvest_alt. Looking across the ensemble we see this pattern repeat, with the manager throwing in the hat and fishing out the population at different times:

Higher costs make this happen instantly, lower costs nearly mimic the Reed optimum strategy.
Code
available in R package form now,install instructions.
(version of code used for figures should be linked from the figures as always too).