Consider two simulated datasets, one under a release of constraint (left) one under an increase in sigma (right). Can we correctly discriminate between these models?
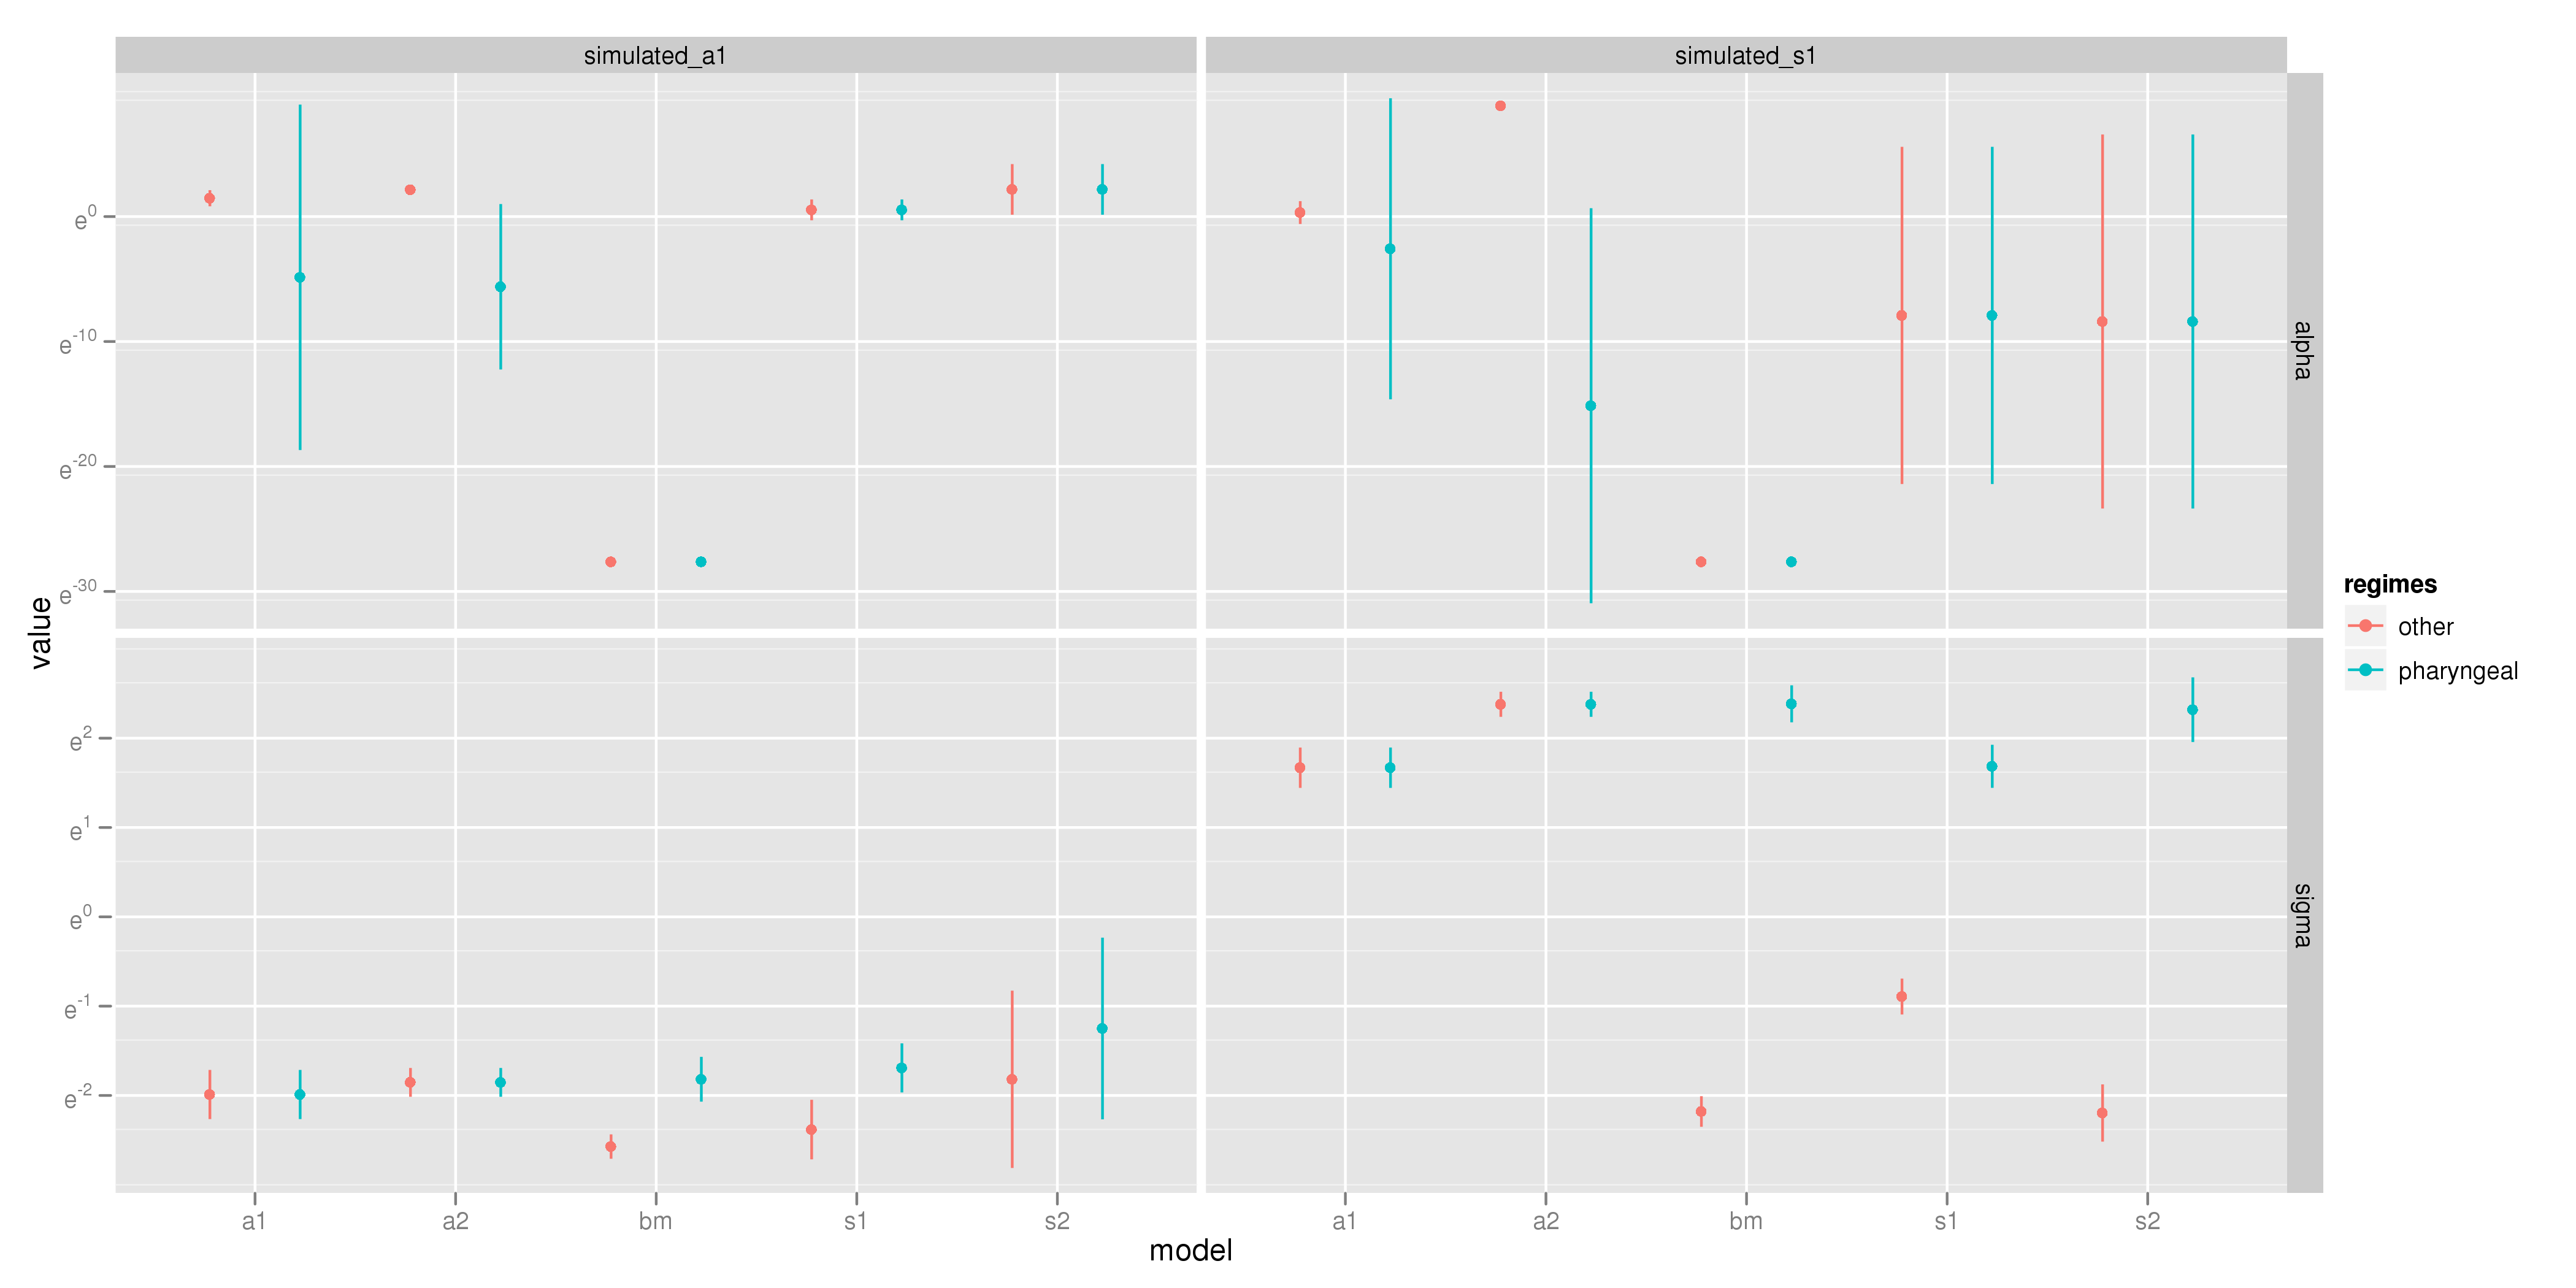
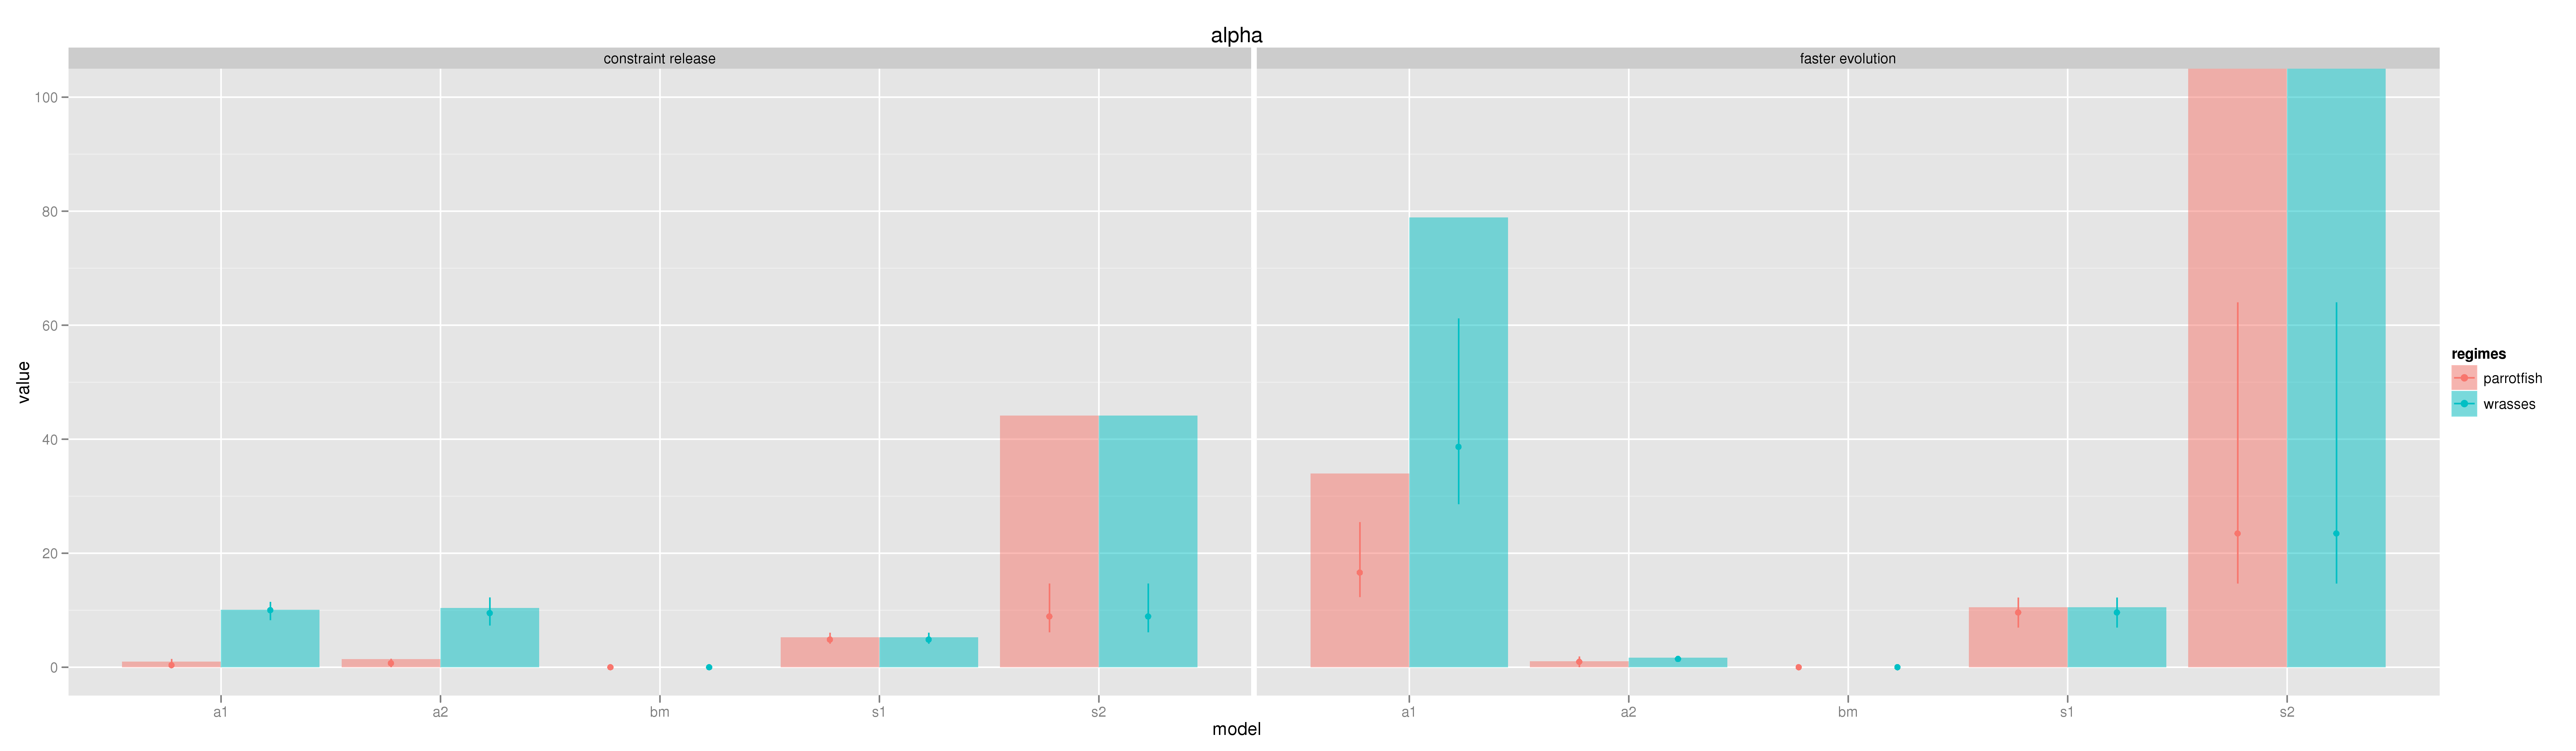
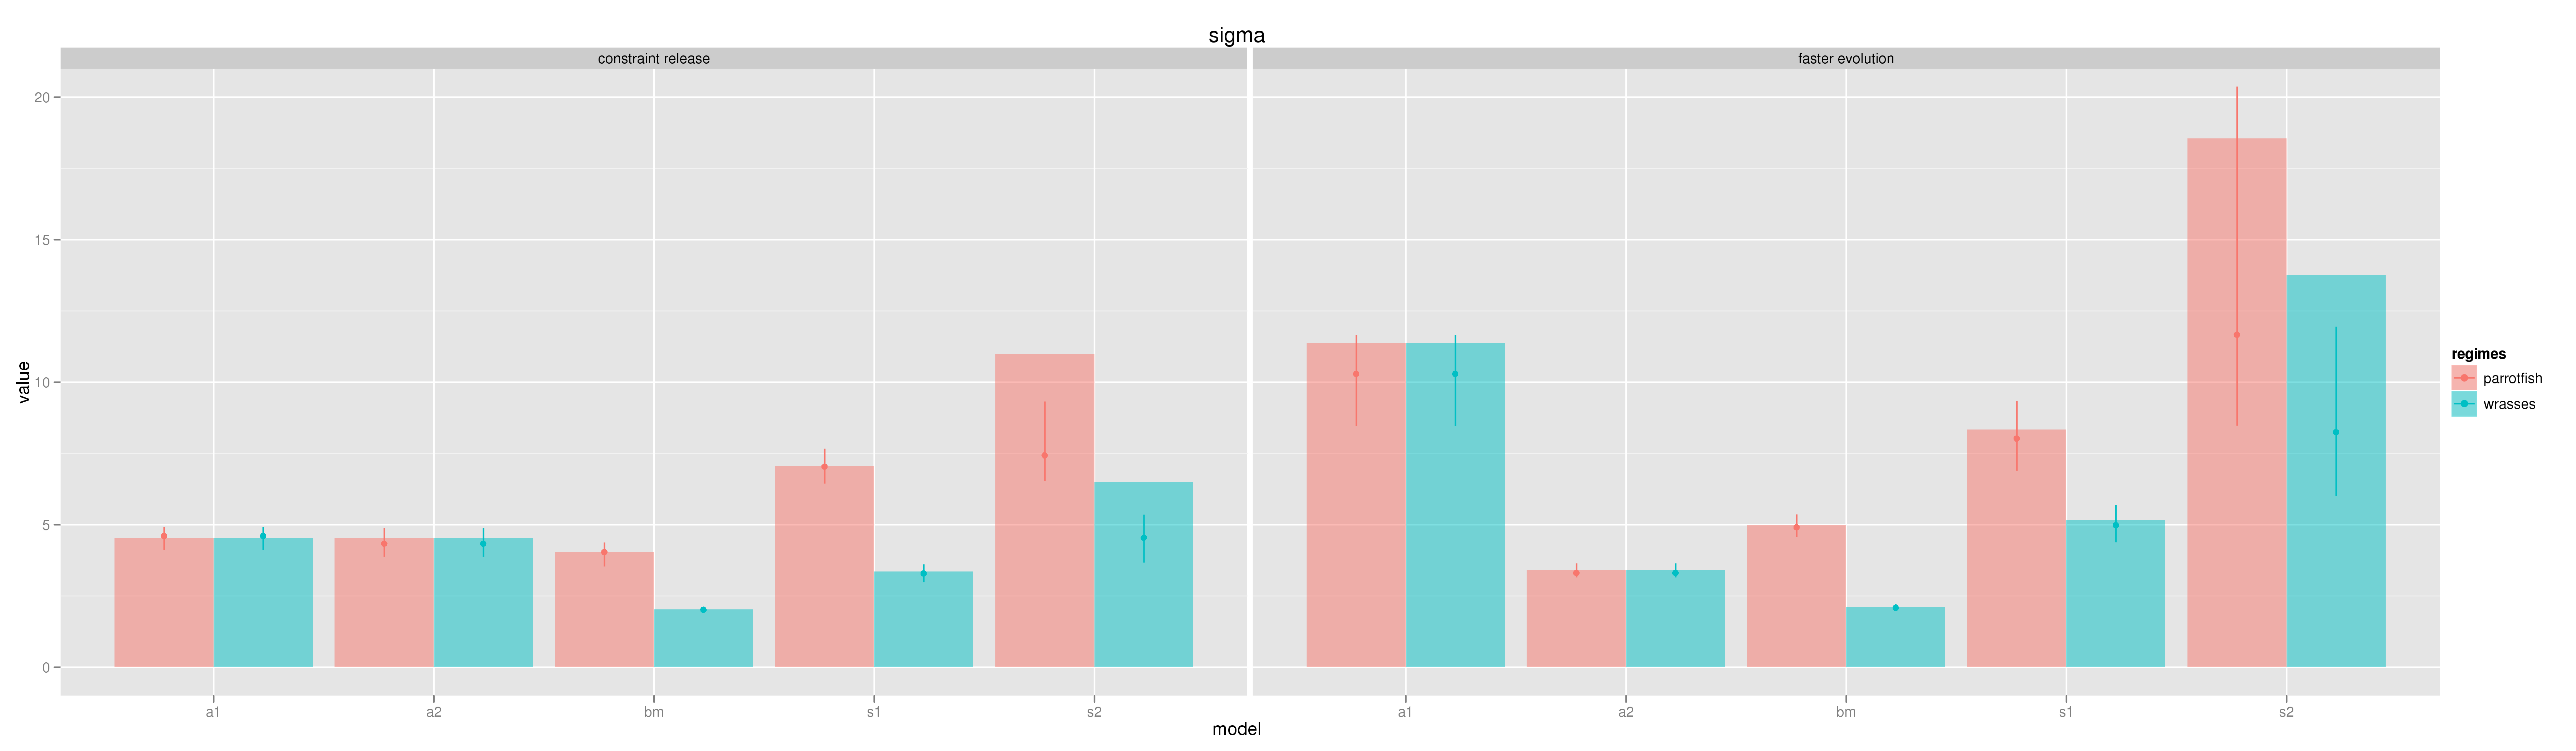
Parameter differences:
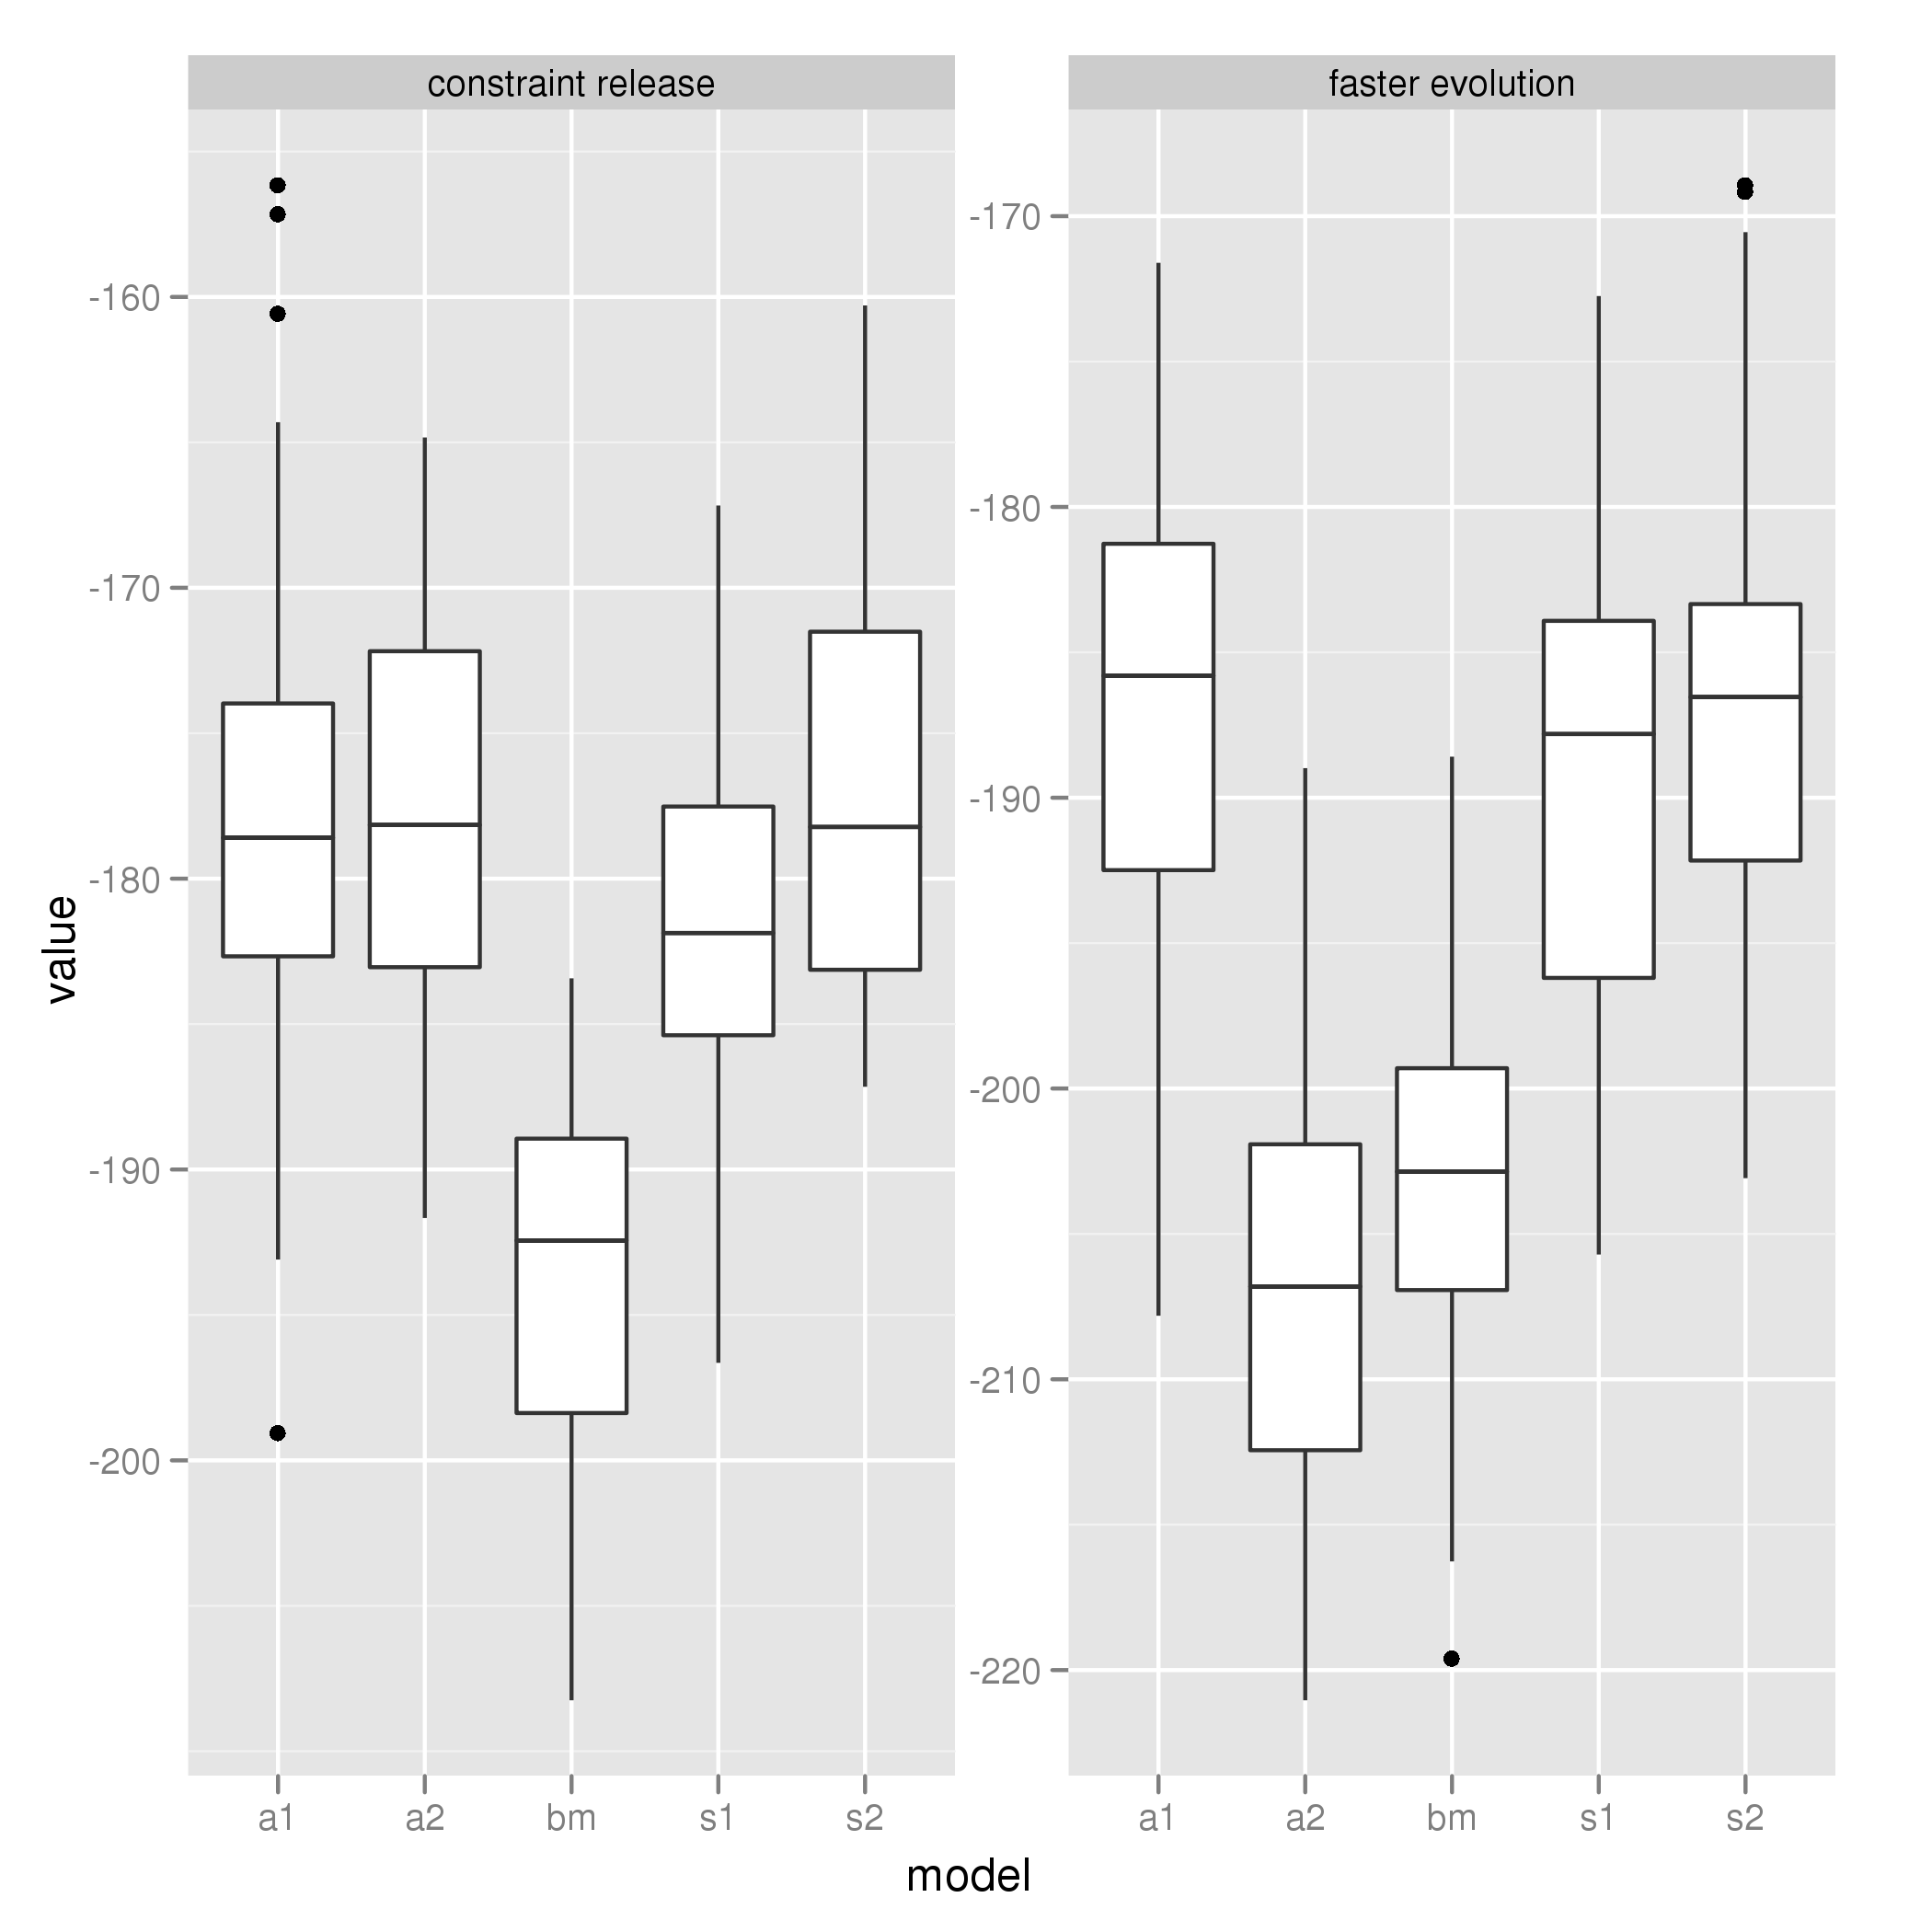
Likelihood differences:
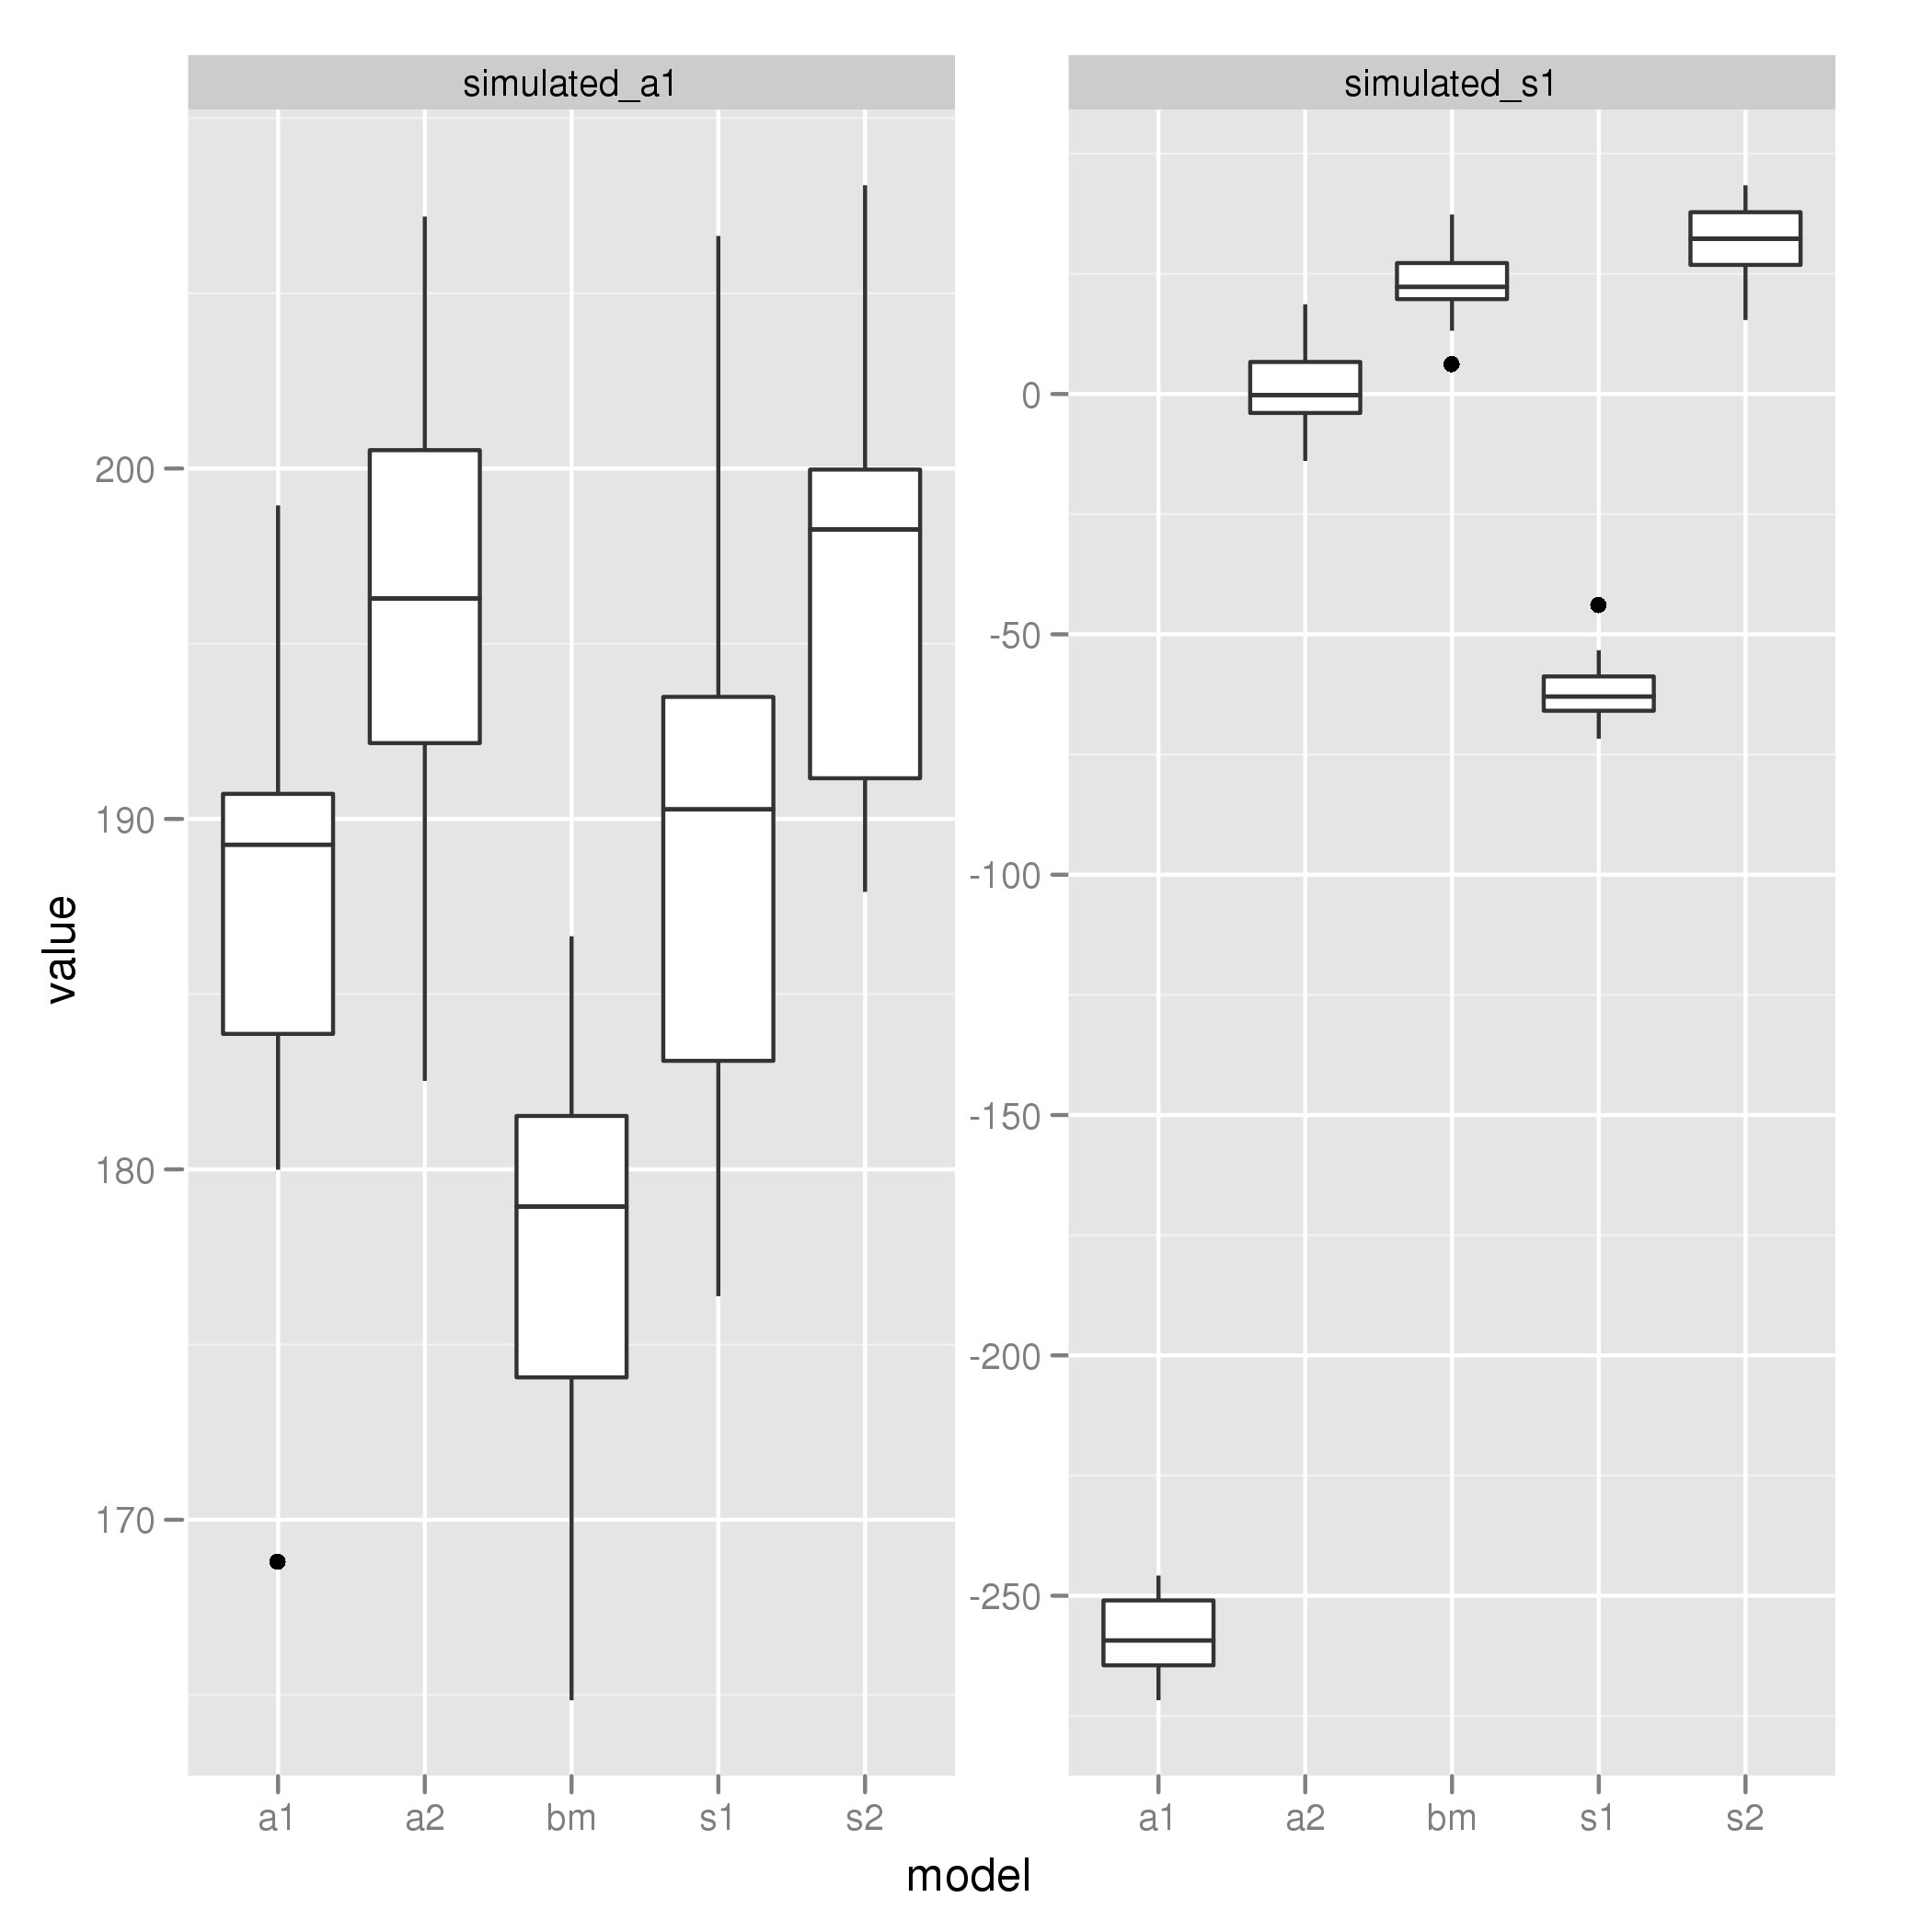
Yup.
Repeated with effect-size scaled to be roughly equivalent for both traits. Wondering if it’s easier to plot parameters out separately like this. Error bars show median and 25/75 % quantile range, with barplots showing the means (note that high outliers makes mean often larger than median).
Note that the resulting likelihood differences are less dramatic in the sigma-simulation trait when it’s variance is more comparable to the alpha example:
Day’s complete log from the image repository.. lots of exploring…
[flickr-gallery mode=“search” tags=“phylogenetics” min_upload_date=“2011-12-02 8:00:37” max_upload_date=“2011-12-02 23:23:37”]