- Revise abstract. 10a-11a. done.
Misc data handling
11-1pm
- wrote a file to fix flickr data file names that are occasionally mangled by parallel loop printing.
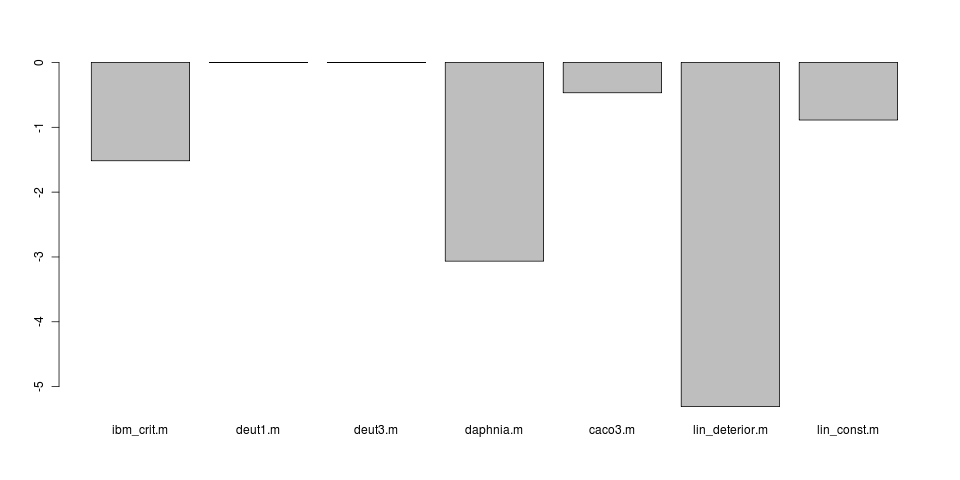
- wrote a file to plot \(m T\) values on each dataset to get a sense of which have the most dramatic warning signals. running on one.
- locale troubles on install lead to errors in data read
Error in make.names(col.names, unique = TRUE) :
invalid multibyte string 2
ERROR: installing package indices failed- fixed by running in terminal or adding to .bashrc:
export LANG=C- and now my site is down. shoot.
Data wrangling:
ibm critical
- Ind. based model, deteriorating stability.

- Data simulated with demo/ibm_sims.R, datafile stored in data/ibms.rda. Not handling seeds at the moment so individual simulations will differ. Instead, storing consistent data files from the simulations
- Complete runs at original sampling and resampled at 25, 50, 100, 200, 500 datapoints for all summary statistics and likelihood.
Daphnia H6
H6 Daphnia dataset from data/drake.rda, drake_deterior$H6 dataset.
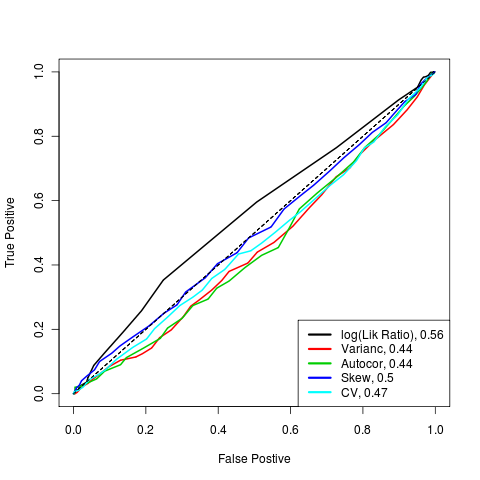
Complete runs at original sampling and resampled at 25, 50, 100, 200, 500 datapoints for all summary statistics and likelihood.
Run using LSN model, should be rerun using LTC model. Now running on c0-8.
Strongest signal is from the I9 dataset:

      G10.m         G6.m         G7.m         G8.m         G9.m        H10.m
  -1.1013887    0.9141734   -0.8813874    0.3885321    1.0958326   -1.5147485
        H6.m         H8.m        I10.m         I6.m         I7.m         I8.m
  -3.0649959   -0.5079393    0.5239186   -2.5343564   -0.9253477   -3.4916514
        I9.m        J10.m         J6.m         J7.m         J8.m         J9.m
-225.4806438   -0.2427629    1.1574219   -4.6880847    0.8195433   -1.0447987
        K6.m         K7.m         K8.m         K9.m        L10.m         L6.m
   0.1488124    0.6807473    1.7837302   -0.8710619    1.0900158    0.2059365
        L7.m         L8.m         L9.m        H72.m        H92.m       K102.m
   0.4682649    1.3032260    0.7171783    0.1463689    0.1516157    1.9654239
trying the I9 dataset on c0-23
Deut3
Deterium levels from Glaciation III Original data run on all indicators:
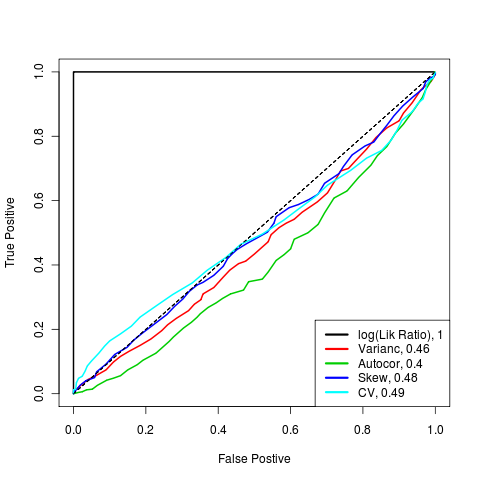
Sampling at 25,50,100,200,500 run for the likelihood approach (in same datafile as original runs). Need to debug runs on the indicator statistics.
Sampling at fractional percentages for likelihood also available: 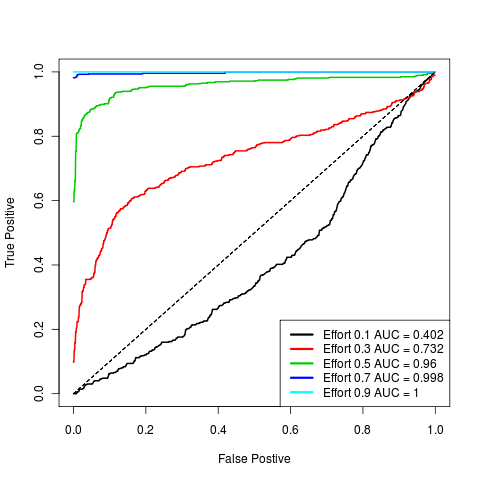
ibm stable
Not run yet. Consider estimating with bounded \(m<0\) for destabilizing test only.
Deut1
Deuterium levels from Glaciation I, data/deuterium.rda, deuterium[[1]] dataset. Original dataset on all indicators:
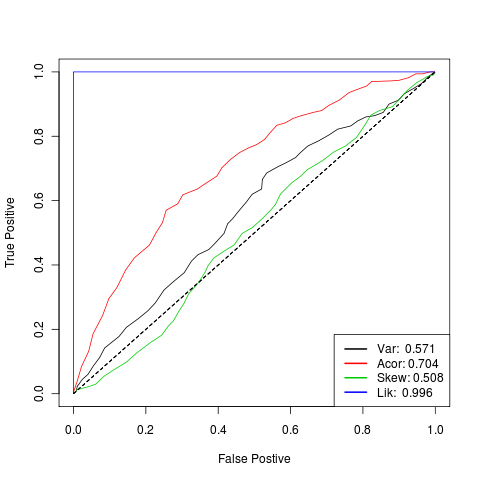
nearby also some sampling at different efforts for likelihood method.
Potential alternate datasets:
CaCO3
- very preliminary analysis:

- Running at sampling levels 25,50,100,200,500 on c0-2.farm
Data trouble-shooting
Discovered window was not being adjusted during the increased sampling comparisons for the summary statistics. (threw an error when full time length was less than the windowsize (half the length of the original data).
Could have potentially significant impact on results. Now fixed, though needs testing to make sure it is using the correct windowsize each time. Rerunning code looks not to make a difference: i.e. for the ibm model summary stats show improvement with increased sampling in this range, while in the deut example they do not. Not surprising, as earlier examples (pre-correction) needed substantially higher multiples (10, 20 times the original data length, already in 100s) to show improvement.
Time series up to 2000 still show no sign of improvement for other statistics: 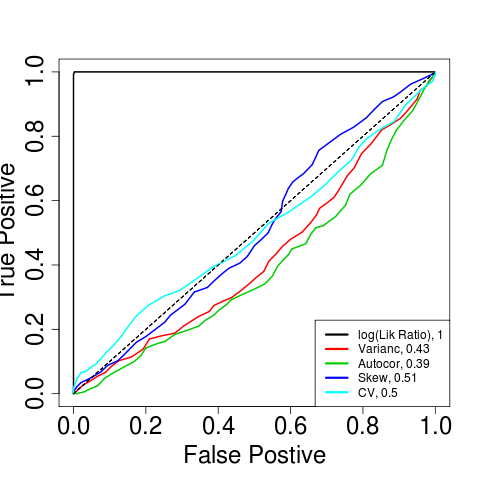
maybe going to have to go back to multiplication factor rather than fixed number. Now running at up to 20,000 pts (deut_replot.R, zero, n5). also now running different windowsizes explicitly as part of test in deut_analysis.R (zero, n10).
Get preliminary figures
send main text to Marissa, Marcel for comments
Revise Appendix
Notebook
post pending drafts.
Code vignette and cleanup
Postponed till later