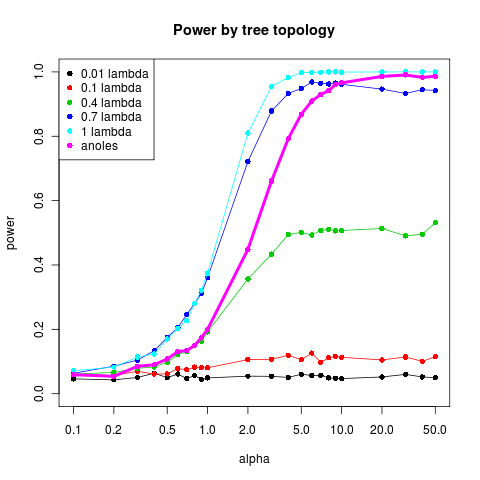
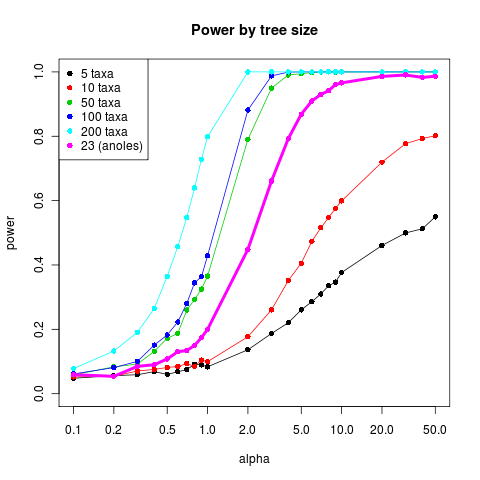
Finished the runs comparing the power to detect different strengths of selection using different size phylogenetic trees all generated under pure-birth process simulation, and then under trees of the same size but gradually lengthening the tips, (or rather shortening everything but the tips) using the lambda transformation, which puts the informative differences deep in the past where they are less reflected in the stationary state. Bure-birth (also the constant rate birth-death) trees on the other hand are particularly twiggy and quite informative. Though I’ve claimed that tree structure, not just size, matters in determining power, I haven’t shown it yet (other than in the trivial case of a star phylogeny), so here we go:


Graphs show the power to distinguish the strength of selection alpha in an OU model from a purely Brownian model. I have included the phylogeny from the Anoles dataset of 23 taxa for comparison.