Description: an example trying to detect early warning signals in data from fisheries collapses
Set up markdown format and image uploads.
render_wordpress()
opts_knit$set(upload = TRUE)
opts_knit$set(imgur.key = getOption("imgur"))
Load required libraries
require(warningsignals)
require(ggplot2)
require(reshape2)
Load the data
scotia <- read.csv("../../data/rawdata/sau_scotia.csv")Visualize data
dat_scotia <- melt(scotia,
    id = "Year")
p_scotia <- ggplot(dat_scotia,
    aes(Year, value, fill = variable)) +
    geom_area()
print(p_scotia)
Compute some indicators
Define some indicators
window_var <- function(X,
    windowsize = (length(X)/2)) {
    out <- sapply(0:(length(X) -
        windowsize), function(i) {
        var(X[(i + 1):(i +
            windowsize)])
    })
    c(rep(NA, length(X) -
        length(out)), out)
}

window_autocorr <- function(X,
    windowsize = (length(X)/2)) {
    out <- sapply(0:(length(X) -
        windowsize), function(i) acf(X[(i +
        1):(i + windowsize)],
        lag.max = 1, plot = F)$acf[2])
    c(rep(NA, length(X) -
        length(out)), out)
}
Reformat the data, uses data.table to perform computations over species
require(data.table)
fish <- data.table(subset(dat_scotia,
    Year < 1992))
tmp <- data.frame(species = fish$variable,
    Year = fish$Year, Stock = fish$value,
    variance = fish[, window_var(value),
        by = "variable"]$V1,
    acor = fish[, window_autocorr(value),
        by = "variable"]$V1)

dat <- melt(tmp,
    id = c("Year", "species"))
Cod are approaching a crash, but lobster are going strong, but both seem to show the same pattern.
ggplot(subset(dat,
    species %in% c("Atlantic.cod"))) +
    geom_point(aes(Year,
        value)) + facet_grid(variable ~
    species, scales = "free_y")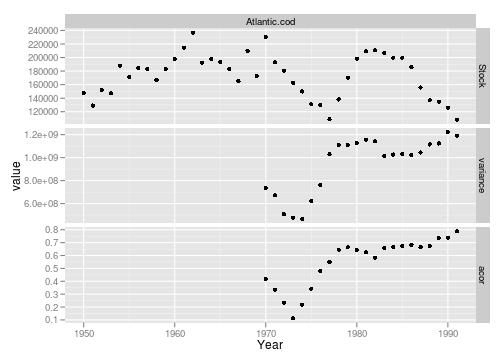
ggplot(subset(dat,
    species %in% c("American.lobster"))) +
    geom_point(aes(Year,
        value)) + facet_grid(variable ~
    species, scales = "free_y")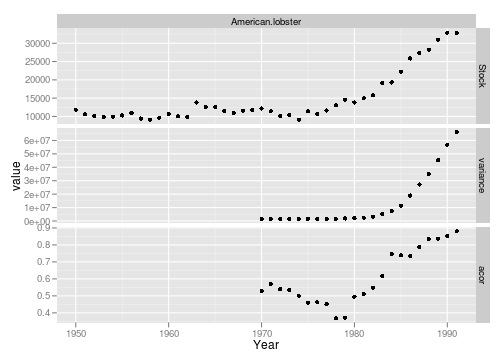
Note the indicator patterns vary widly and rather arbitrarily among species
dt <- data.table(dat_scotia)
indicator <- data.frame(dt[,
    window_var(value),
    by = "variable"], Year = dat_scotia$Year)
ggplot(indicator) +
    geom_line(aes(Year,
        V1)) + facet_wrap(~variable,
    scales = "free_y")