Create the data. We’ll save files as some of these code chunks need to be run on the cluster for large memory use.
require(populationdynamics)
pars = c(Xo = 500, e = 0.5, a = 180, K = 1000, h = 200,
    i = 0, Da = 0, Dt = 0, p = 2)
sn <- saddle_node_ibm(pars, times=seq(0,5000, length=50000), reps=1)
save("sn", "file=prosecutor.rda")
Subset the chance transitions
d <- dim(sn$x1)
crashed <- which(sn$x1[d[1],]==0)
dat <- melt( sn$x1[,crashed] )
names(dat) = c("time", "reps", "value")
save("dat", file="crashed.rda")
Zoom into the region before the crash for purposes of the analysis
require(plyr)
zoom <- ddply(dat, "reps", function(X){
    tip <- min(which(X$value==0))
    index <- max(tip-800,1):tip
    data.frame(time=X$time[index], value=X$value[index])
    })
Plot the first couple examples
require(ggplot2)
ggplot(subset(zoom, reps < 10)) + geom_line(aes(time, value)) + facet_wrap(~reps, scales="free")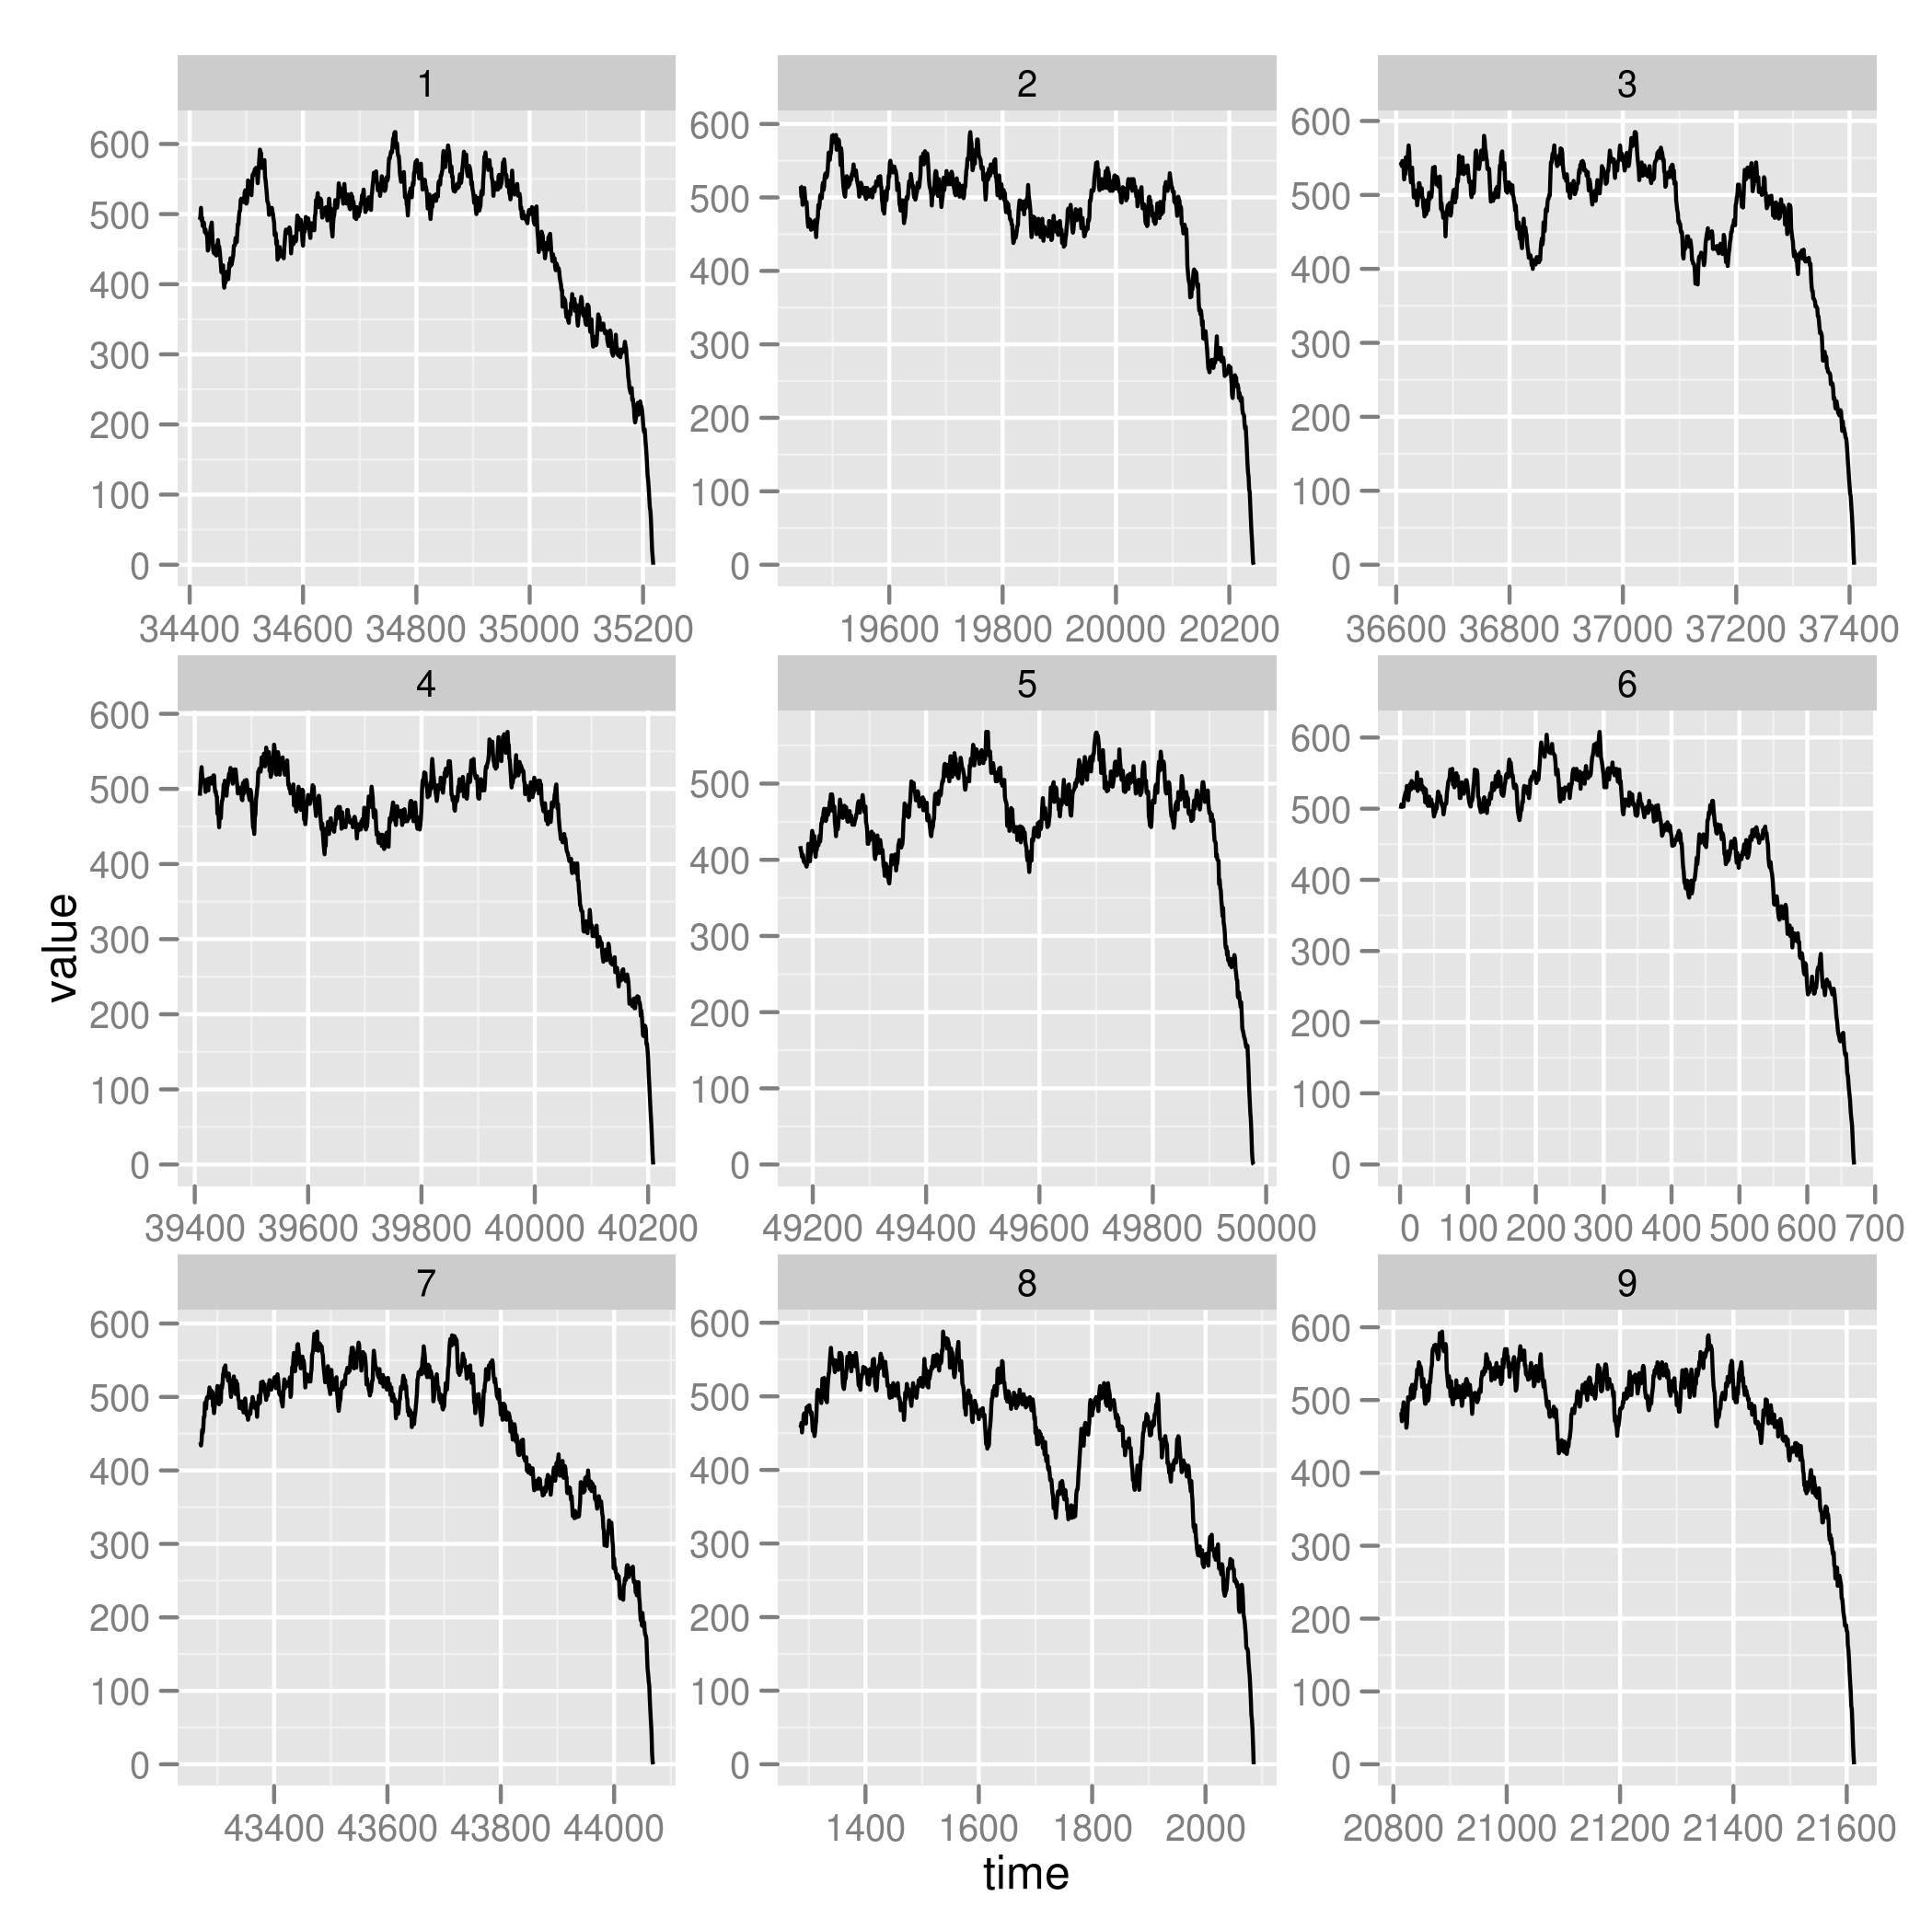
Test analysis on model fit:
load("zoom.rda")
L <- length(unique(dat$reps))
library(snow)
cluster <- makeCluster(80, type="MPI")
clusterEvalQ(cluster, library(earlywarning)) # load a library
clusterExport(cluster, ls()) # export everything in workspace
models <- parLapply(cluster, 1:L, function(i)
  stability_model(zoom[zoom$rep==i, c("time", "value")], "LSN")
  )
stopCluster(cluster)
save("models", file="models.rda")
Once this step is complete, we can create the distribution of different indicators
 load("zoom.rda")
 load("models.rda")
# plot indicators
require(plyr)
require(earlywarning)
indicators <- ddply(zoom, "reps", function(X){
    Y <- data.frame(time=X$time, value=X$value)
    tau_var <- warningtrend(Y, window_var)
    tau_acorr <- warningtrend(Y, window_autocorr)
    i <- X$rep[1]
    m <- models[[i]]$pars["m"]
    c(var=tau_var, acor=tau_acorr, m=m)
})
And plot our results,
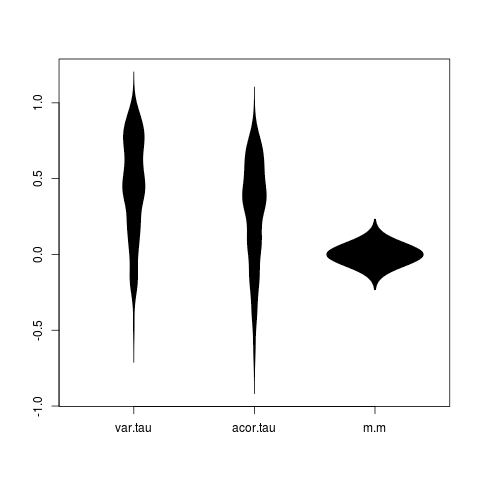
require(reshape2)
dat <- melt(indicators, id="reps")
png("fallacy.png")
require(beanplot)
beanplot(value ~ variable, data=dat, what=c(0,1,0,0))
dev.off()
Which shows clear signs of the fallacy of elevated false positives for the simple indicators (strongest for variance), and nothing that might be mistaken for a false positives in the model-based indicator.