Variability in the appearance of a trend
nreps <- 64
require(populationdynamics)
pars = c(Xo = 730, e = 0.5, a = 100, K = 1000,
    h = 200, i = 0, Da = 0.09, Dt = 0, p = 2)
time = seq(0, 990, length = 100)
sn <- saddle_node_ibm(pars, time, reps = nreps)
We reformat the replicates into long form,
X <- data.frame(time = time, value = sn$x1)
require(reshape)
dat <- melt(X, id = "time")
names(dat)[2] <- "reps"
require(plyr)
window <- length(X[["time"]])/2
tmp <- ddply(dat, "reps", function(X) window_autocorr(X$value,
    windowsize = window))
Tidy up the warning signal data
acorr <- melt(t(tmp))
acorr <- acorr[-1, ]
names(acorr) <- c("time", "reps", "value")
acorr$time <- as.numeric(gsub("\\D", "", acorr$time))
class(acorr$value) <- "numeric"
and plot the replicate warning signals
require(ggplot2)
ggplot(acorr) + geom_line(aes(time, value)) +
    facet_wrap(~reps) + opts(title = "Autocorrelation on replicates from a system approaching a crash")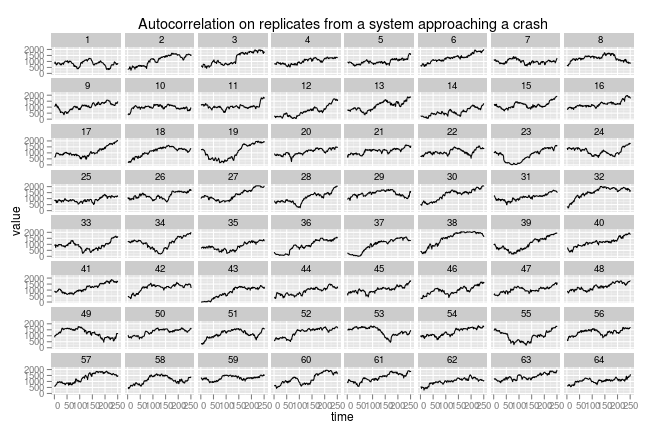
Stable system
Stable model simulations
pars = c(Xo = 730, e = 0.5, a = 150, K = 1000,
    h = 200, i = 0, Da = 0, Dt = 0, p = 2)
time = seq(0, 990, length = 100)
sn <- saddle_node_ibm(pars, time, reps = nreps)
X <- data.frame(time = time, value = sn$x1)
stable_dat <- melt(X, id = "time")
names(stable_dat)[2] <- "reps"
tmp <- ddply(stable_dat, "reps", function(X) window_autocorr(X$value,
    windowsize = window))
acorr <- melt(t(tmp))
acorr <- acorr[-1, ]
names(acorr) <- c("time", "reps", "value")
acorr$time <- as.numeric(gsub("\\D", "", acorr$time))
class(acorr$value) <- "numeric"
ggplot(acorr) + geom_line(aes(time, value)) +
    facet_wrap(~reps) + opts(title = "Autocorrelation on replicates from a stable system")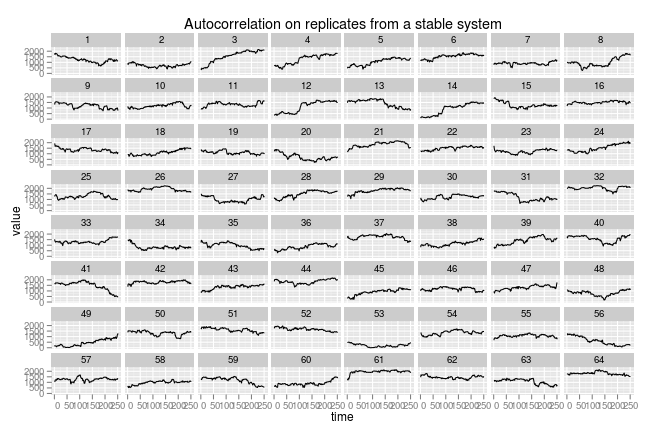
Variance pattern
Replicates approaching a crash
tmp <- ddply(dat, "reps", function(X) window_var(X$value,
    windowsize = window))
acorr <- melt(t(tmp))
acorr <- acorr[-1, ]
names(acorr) <- c("time", "reps", "value")
acorr$time <- as.numeric(gsub("\\D", "", acorr$time))
class(acorr$value) <- "numeric"
ggplot(acorr) + geom_line(aes(time, value)) +
    facet_wrap(~reps) + opts(title = "Variance on replicates approaching a crash")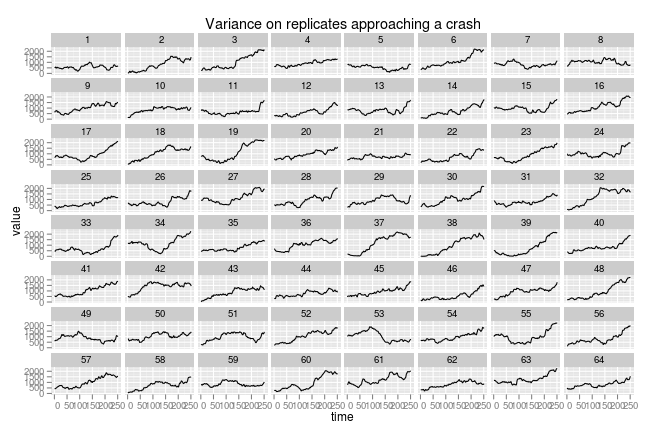
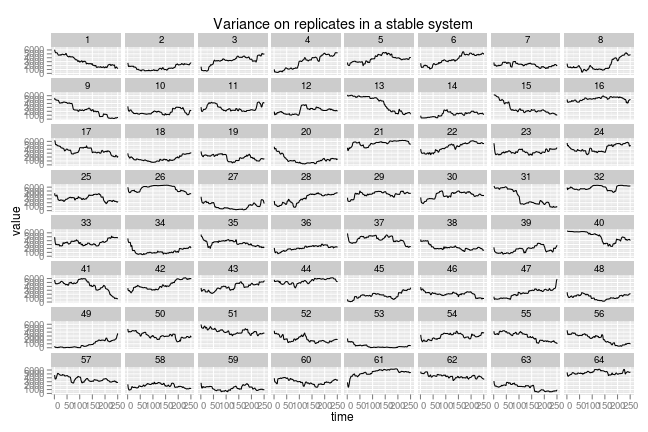
Replicates from a stable system
tmp <- ddply(stable_dat, "reps", function(X) window_var(X$value,
    windowsize = window))
acorr <- melt(t(tmp))
acorr <- acorr[-1, ]
names(acorr) <- c("time", "reps", "value")
acorr$time <- as.numeric(gsub("\\D", "", acorr$time))
class(acorr$value) <- "numeric"
ggplot(acorr) + geom_line(aes(time, value)) +
    facet_wrap(~reps) + opts(title = "Variance on replicates in a stable system")