My last post was a bit pessimistic, sometimes I can still miss the forest for the trees. Hidden in those figures, the main point has been staring me in the face. So let’s try this again.
Stochastic limits to evolutionary branching is the story of two dueling timescales. The first timescale is that of the evolutionary process: the frequency of steps (mutation rate, $ $) and the size of the steps (mutation kernel standard deviation $ _{}$), on top of which we add the selection gradient, created by the ecology. The second timescale is that of ecological coexistence, which in low noise situations should be much longer, and hence irrelevant.
While the approach to the branching point depends on the width of the resource kernel and is independent of the competition kernel. At the branching point, how much narrower the competition kernel is compared to the resource kernel (in units of the mutational step size) determines how stable the coexistence of the early dimorphism is – the second timescale. In most adaptive dynamics simulations this second timescale is irrelevant, being much longer than the former timescale, at least by assumption. However, this need not be the case.
When this timescale (influenced by most parameters: population size, mutation size relative to competition kernel; resource kernel matters more weakly[ref] should add the equations for approximating the coexistence time to illustrate this[/ref]) becomes on the same order as the evolutionary timescale of waiting until the next mutation (determined by the mutation rate and population size) suddenly it impacts the waiting time until branching.
This can be characterized by the number of times a dimorphism establishes but then fails. Similarly, weak coexistence impacts the number of times the dimorphism survives long enough for the mutation to arrive and establish, only to again collapse.

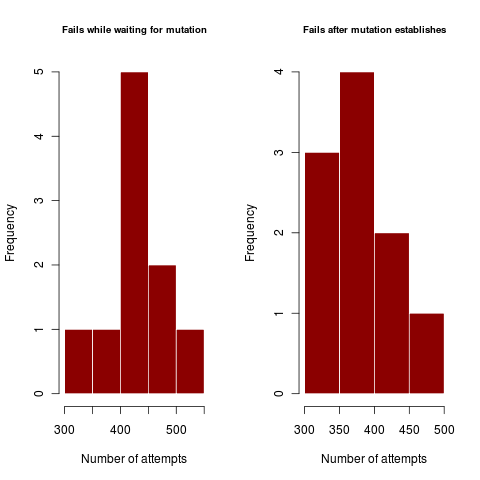
Figures illustrate outside the regime where coexistence times matter, where dimorphism never collapses after establishing. In harsher parameter regime, the dimorphism collapses hundreds of times before enough mutations can accumulate in rapid succession (or a rare large mutation occurs) to create a dimorphism of substantially different traits so as to coexist.
Respective codes for each figure to show parameter values:
 all[[2]] <- ensemble_sim(rep=rep, sigma_mu = 0.05, mu = 1e-3, sigma_c2 = .1, sigma_k2 = 1, ko = 500, xo = 0.1, threshold = 30)
all[[3]] <- ensemble_sim(rep=rep, sigma_mu = 0.03, mu = 5e-4, sigma_c2 = .3, sigma_k2 = 1, ko = 500, xo = 0.1, threshold = 30)(full code).
In the first example, a mutation at least two standard deviations out (prob <5%) from the expected value is sufficient to get a standard deviation away from the competition kernel (i.e. 60% competition). Step-size limited mutations should have very similar failures for the first and second plots, using lots of little steps each with high failure rate. Mutation-rate limited processes use one big jump, and show a high disparity between the failures in the first case and failures in the second.

Figures like the above show that when coexistence is hard (sigma_c approaches sigma_k = 1) failure rates can be very high. As the rates are very similar, this case appears to be clearly step-size limited, proceeding through many mutations with low probability of success of coexisting.
Further Exploration: Illustrating this second mode (mutation-limited)
Trying some examples now to see if I can create mutation-rate limited example by running the above at sigma_mu=.5 rather than .3 when varying mutation rate over 1e-4 to 1e-3.
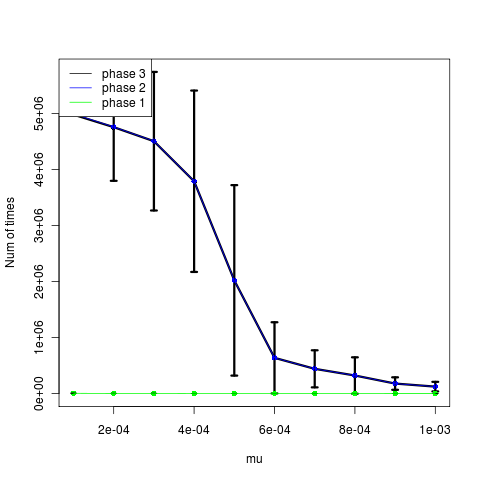
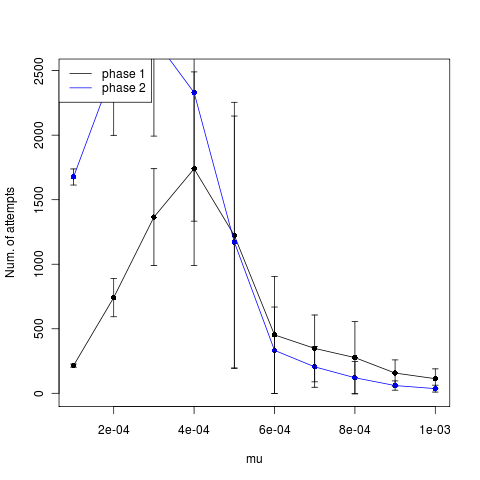
The low mutation rates appear to time out instead (time until phase, left figure). The higher mutations actually show slightly fewer attempts after establishment, but not a strong signal. Trying now with larger mutation steps.
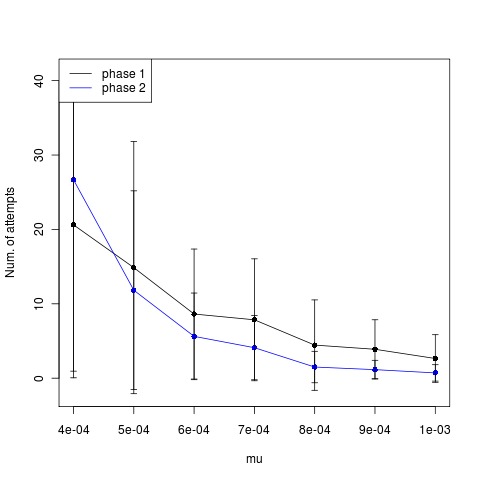
Still shows no indication of rate limited mutation.