Current Situation & Challenges
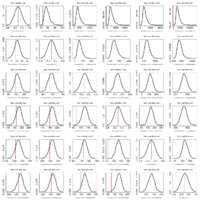
2000 bootstraps of models fitted to simulated ou2 data
- A single data set is produced by simulation under a specified ou2 model on the Labrid tree (actually one that was fitted to the original Labrid data).
- Each model (Brownian motion and 1 to 5 separate OU peaks (assigned by my partition function) is fitted to this dataset.
- Each fitted model is used to generate 2000 replicate datasets
- For each replicate dataset, the model used to generate it is compared to each other model in likelihood ratio test 2(log(L1) − log(L2)), where L1 is the likelihood of the model that generated the data. In this version, the model likelihood is simply evaluated with its original parameter assignments, not refit to the data first.
- The pattern seems to be: each model fit the data it produced better than any other model, particularly for the more complicated models. Consequently, the bootstrap distributions are always positive.
- The more complicated models have higher likelihood scores on the original data, making the location of the red line marking the original data always fall in the negative region for the upper triangle of the graph matrix, where simulations coming from simpler models are compared against the more complicated ones. This seems to consistently reject the simpler model in favor of the complicated one.
- Meanwhile, the lower triangle compares data generated under the complicated against the simple. When the complex (ou2+) are compared against ou1 and bm in this way, the simple model does not reject the complex one – that is, data produced by the complex model scores an expected amount better than the simple one; the red line falls near the center of the bootstrap distribution.
- However, as the models get more complex, the data appears to fall at relatively unlikely small scores. (comparing ou2 vs ou3 for instance) This suggests while the more complex model is still performing better, one would actually suspect it to perform much better still than it actually is; and on the whole its performance is unexpectedly poor for it to be the correct model.
- The balance of rejecting one but not both comparisons might make an argument for ou2 being correct, though the case is not as clear as might hope with simulated data. Of course the power to distinguish depends on the tree as well.
Next Steps
Misc/Notes
Seminar nominations – submitted. Aaron King, Joe Felsenstein, Richard McElreath, Luke Harmon.
F1000 Reviews Need to submit evaluations
[1] Weak population regulation in ecological time series Nicolas L. Ziebarth, Karen C. Abbott, Anthony R. Ives https://www3.interscience.wiley.com/journal/122659274/abstract
[2] Field theory for biogeography: a spatially explicit model for predicting patterns of biodiversity James P. O’Dwyer, Jessica L. Green https://www3.interscience.wiley.com/journal/122680792/abstract
[3] Phylogenetic diversity metrics for ecological communities: integrating species richness, abundance and evolutionary history Marc W. Cadotte, T. Jonathan Davies, James Regetz, Steven W. Kembel, Elsa Cleland, Todd H. Oakley https://www3.interscience.wiley.com/journal/122680036/abstract
ievobio conference Registration
Interesting seminar by Ilias Tagkopoulos at CPB today. Good example of high performance computing for stochastic simulations. Latest versions are also explicitly spatial. Strange choice of birth death dynamics however – fixed population size, and when birth occurs, a weaker individual is replaced, when death occurs, a random individual replaces it. Resembles the Moran model, though other work has shown order is important here.